
- Title
-
Gene co-expression network analysis reveals mechanisms underlying ozone-induced carbamazepine toxicity in zebrafish (Danio rerio) embryos
- Authors
- Pohl, J., Golovko, O., Carlsson, G., Örn, S., Schmitz, M., Ahi, E.P.
- Source
- Full text @ Chemosphere
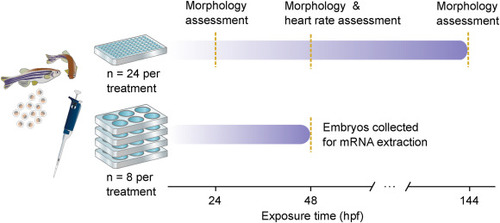
Schematic representation of the zebrafish embryo exposure regime showing the two parallel exposures. |
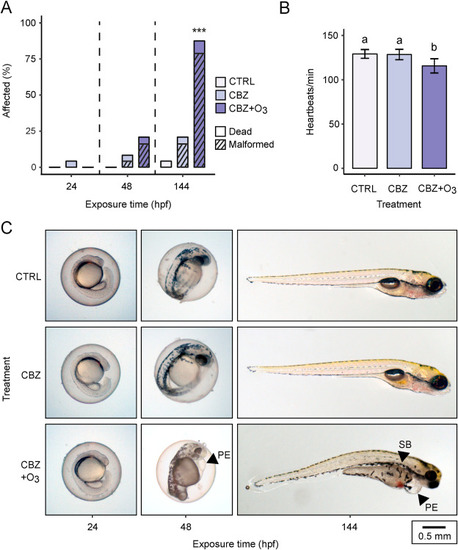
(A) Embryo heart rate (heart beats per minute, mean ± sd) at 48 hpf (different letters indicate a significant deviation (p < 0.05, Tukey HSD test), (C) representative images of embryo-larvae in the three treatment groups at 24, 48, and 144 hpf with arrows indicating typical malformation (PE: pericardial edema, SB: lack of swim-bladder inflation), (D) proportion affected (dead and malformed) embryo-larvae at 24, 48, and 144 hpf (∗∗∗: p < 0.001 in Bonferroni adjusted Fisher’s exact test). |

Expression differences of selected candidate genes, cavin4a co-expressed genes, and TFs involved in cardiovascular formation and functions in the three treatment groups. Means and standard deviations of fold changes in expression of eight biological replicates are shown for each of the groups. Significant differences between treatments are indicated by different letters (p < 0.05, Tukeys HSD test). |
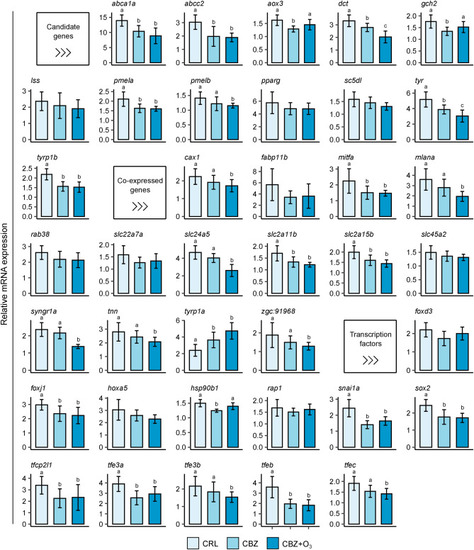
Expression differences of selected candidate genes; dct, pmelb, and tyr co-expressed genes; and TFs involved in zebrafish embryonal development the three treatment groups. Means and standard deviations of fold changes in expression of eight biological replicates are shown for each of the groups. Significant differences between treatments are indicated by different letters (p < 0.05, Tukeys HSD test). |
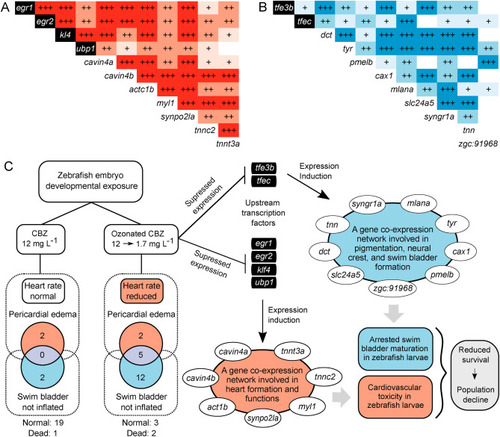
Pairwise expression correlations between the members of the cardiovascular (A) and embryonic (B) developmental co-expression networks and their upstream regulators in zebrafish larvae. The plus signs indicate positive Pearson correlation coefficients, and 1 to 3 signs represent significant levels of p < 0.05, p < 0.01 and p < 0.001. (C) A schematic AOP illustration of the investigated mechanisms underlying ozonated CBZ toxicity phenotypes. |