
Image
|
Figure Caption
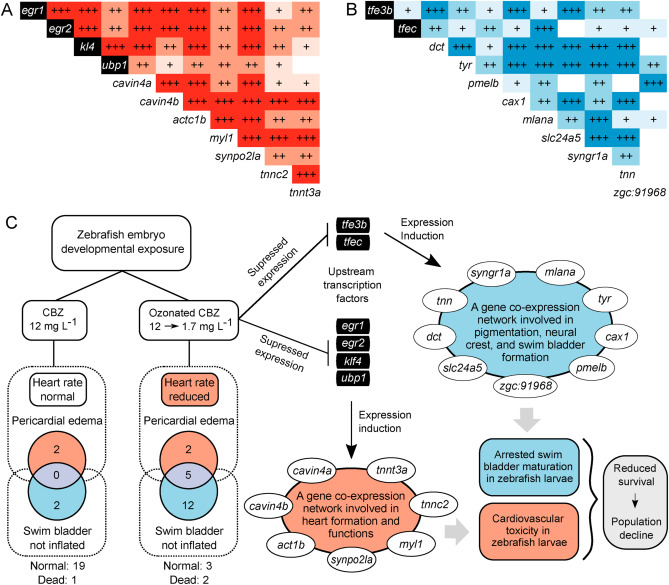
Fig. 5 Pairwise expression correlations between the members of the cardiovascular (A) and embryonic (B) developmental co-expression networks and their upstream regulators in zebrafish larvae. The plus signs indicate positive Pearson correlation coefficients, and 1 to 3 signs represent significant levels of p < 0.05, p < 0.01 and p < 0.001. (C) A schematic AOP illustration of the investigated mechanisms underlying ozonated CBZ toxicity phenotypes.
Acknowledgments
This image is the copyrighted work of the attributed author or publisher, and
ZFIN has permission only to display this image to its users.
Additional permissions should be obtained from the applicable author or publisher of the image.
Full text @ Chemosphere