
- Title
-
Intestinal Transcriptome Analysis Reveals Enrichment of Genes Associated with Immune and Lipid Mechanisms, Favoring Soybean Meal Tolerance in High-Growth Zebrafish (Danio Rerio)
- Authors
- Valenzuela, L., Pacheco, S., Rincón, G., Pavez, L., Lam, N., Hernández, A.J., Dantagnan, P., González, F., Jilberto, F., Ravanal, M.C., Ramos, C., Garcia, H., Araneda, C., Ulloa, P.E.
- Source
- Full text @ Genes (Basel)
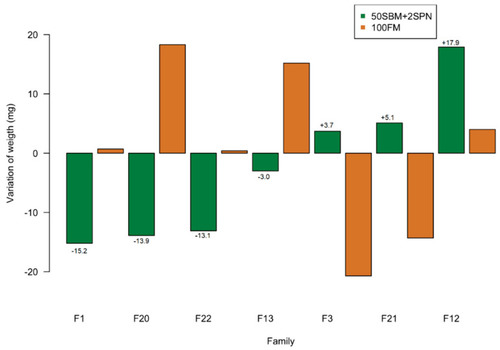
Variation in weight gain of families that showed a genotype-by-environment interaction in response to 50SBM + 2SNP vs. 100FM diets. Families with the greatest (F3, F21, and F12) and least weight gain (F1, F20, F22, and F13) in terms of deviation from the 50SBM + 2SPN population mean (120 ± 33 mg). |
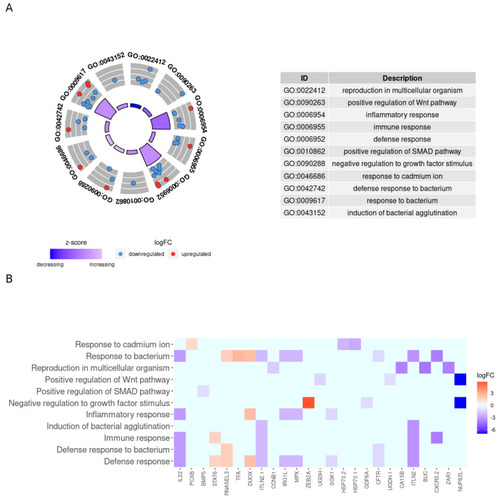
Enriched biological processes decreased in HG-50SBM + 2SPN fish and associated genes. (A) Circle plot of decreased biological processes in HG-50SBM + 2SPN fish. The red and blue dots on the gray ring represent the up- or downregulated genes, respectively, that participate in each process. The GO IDs of the biological processes are noted on the outer ring. The inner ring represents the z-score, and the color intensity indicates the degree to which the enriched biological process is decreased. The table on the right shows the name of each biological process by GO ID. (B) Heatmap of the 25 genes participating in biological processes decreased in HG-50SBM + 2SPN fish. Genes are presented as squares. Red indicates an upregulated gene, while blue indicates a downregulated gene. |
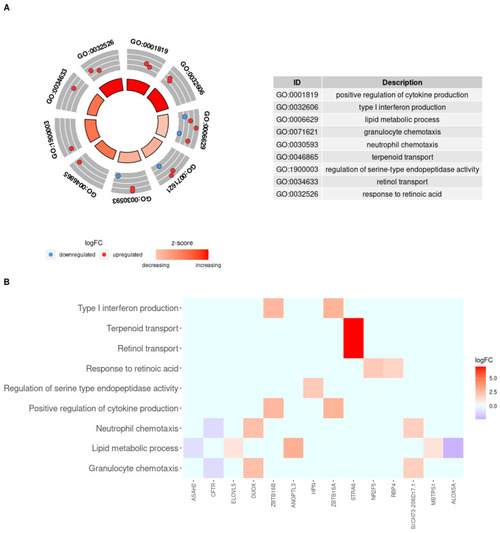
Enriched biological processes increased in HG-50SBM + SPN fish and associated genes. (A) Circle plot of increased biological processes in HG-50SBM + 2SPN fish. The red and blue dots on the gray ring represent the up- or downregulated genes, respectively, that participate in each process. The GO IDs of the biological processes are noted on the outer ring. The inner ring represents the z-score, where the color intensity indicates the degree to which the enriched biological process is increased. The table on the right shows the name of each biological process by GO ID. (B) Heatmap of the 14 genes participating in increased biological processes in HG-50SBM + 2SPN fish. Genes are presented as squares. Red indicates an upregulated gene, while blue indicates a downregulated gene. |
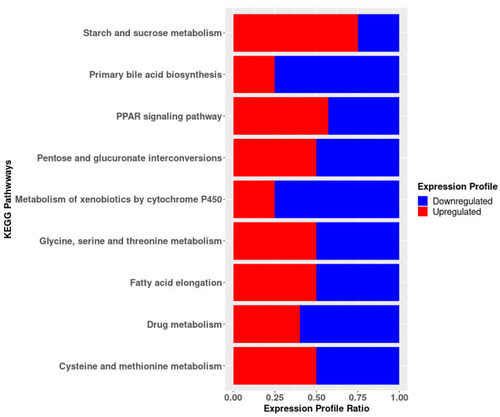
KEGG enrichment analysis from differentially expressed genes between HG-50SBM + 2SPN and LG-50SBM + 2SPN fish. Red and blue regions represent proportion of up- or downregulated genes in HG-50SBM + 2SPN, respectively. |
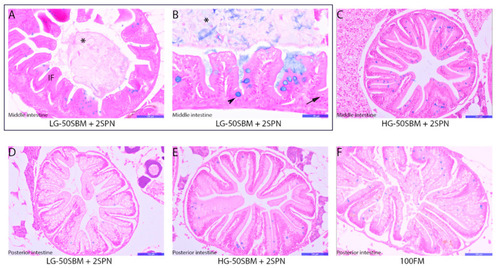
Optical microscopy of intestinal cross sections of zebrafish fed the experimental diets. Histological sections of the middle intestine of a LG-50SBM + 2SPN fish, presented inside the rectangle (A,B). Histological sections of the middle intestine of a HG-50SBM + 2SPN fish (C). Histological sections of the posterior intestine of LG- and HG-50SBM + 2SPN and 100FM fish (E,F). (IF) decreased intestinal fold size and enlarged intestinal lumen; (asterisk) mucus; (arrowhead) goblet cells; (arrow) intraepithelial leukocytes. The scale bar for (A,C–F) corresponds to 100 µm, and the scale bar for (B) corresponds to 50 µm. |
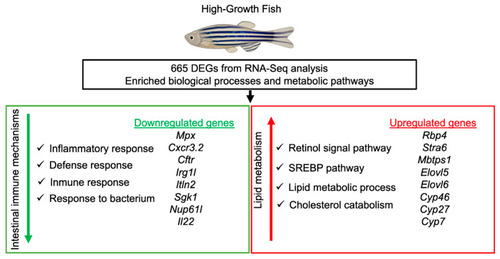
Genes and molecular mechanisms involved in intestinal tolerance to SBM-based diet in high-growth fish. Downregulation of genes associated with the inflammatory immune response and upregulation of genes related to lipid metabolism mediate SBM tolerance. |