
- Title
-
Broad-Spectrum HDAC Inhibitors Promote Autophagy through FOXO Transcription Factors in Neuroblastoma
- Authors
- Körholz, K., Ridinger, J., Krunic, D., Najafi, S., Gerloff, X.F., Frese, K., Meder, B., Peterziel, H., Vega-Rubin-de-Celis, S., Witt, O., Oehme, I.
- Source
- Full text @ Cells
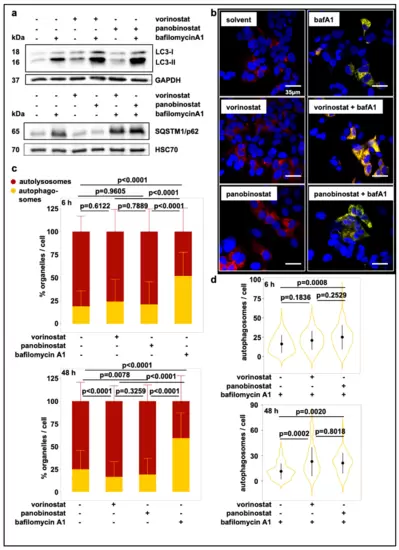
Treatment with broad-spectrum HDAC inhibitors induces autophagic flux. (a) Western Blot displaying LC3-I and LC3-II levels and SQSTM1/p62 levels in whole-cell lysates of SK-N-BE(2)-C cells after 24 h treatment with 500 nM vorinostat or 10 nM panobinostat or solvent control and with or without additional 6h treatment with bafilomycin A1 (100 nM). GAPDH and HSC70 served as a loading control for corresponding Western blots. (b) Confocal fluorescence microscopy analysis of SK-N-BE(2)-C cells. Autophagosome formation was visualized after treatment with vorinostat (500 nM) or panobinostat (10 nM) alone or in combination with 100 nM bafilomycin A1 by using the mCherry-EGFP-LC3B expression construct. Autolysosomes appear red fluorescent only, autophagosomes are red and green fluorescent (yellow in merged channels). Scale bar: 35 µm. (c) Automated quantification of one representative fluorescence microscopic experiments using the mCherry-EGFP-LC3B expression construct 6 h and 48 h after treatment with either HDACi or bafilomycin A1. Each transfected cell was analyzed for green and red fluorescent foci. Statistical analyses: ANOVA with Tukey’s multiple comparison test. (d) Automated quantification and statistical analyses for the combination treatment with bafilomycin A1 as described in (c). |
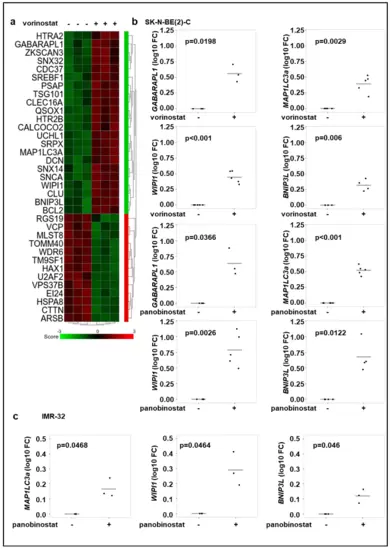
Broad-spectrum HDAC inhibitor treatment increases the expression of autophagy genes. (a) Gene expression analysis of genes with the ontology term “autophagy” of SK-N-BE(2)-C neuroblastoma cells. Cells were treated for 24 h with vorinostat (500 nM) in three replicates. Genes, which are significantly up- or downregulated (p < 0.05) are shown. (b) Realtime RT-PCR analysis of GABARAPL1, MAP1LC3a, WIPI1, BNIP3L after 24 h treatment of SK-N-BE(2)-C cells with vorinostat (500 nM) or panobinostat (10 nM). (c) Realtime Quantitative RT-PCR analysis of MAP1LC3a, WIPI1, BNIP3L after 24 h treatment of IMR-32 cells with panobinostat (4 nM). Statistical analyses were performed using one sample t-test. Boxes represent the SD. |
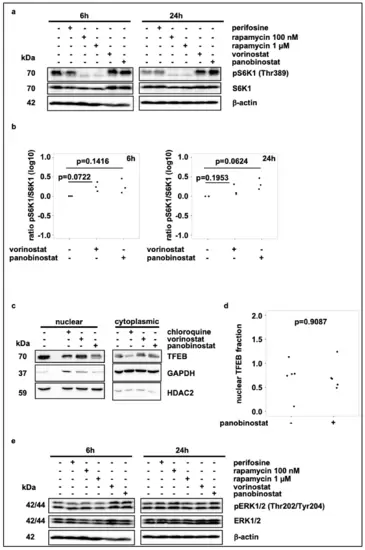
Broad-spectrum HDAC inhibitor treatment does not reduce mTORC1 activity. (a) Western blot analysis of pS6K1 and S6K1 levels after 6 h and 24 h treatment with vorinostat (500 nM) or panobinostat (10 nM). Rapamycin (100 nM and 1 µM) was used as negative control for mTORC1 activity and thus S6K1 phosphorylation. Note that blots were also used to analyze ERK1/2 phosphorylation in Figure 3e. (b) Quantification of Western blot analysis of pS6K1 and S6K1 expression, normalized to solvent control. Statistical analyses: ANOVA with Tukey’s multiple comparison test. (c) Subcellular localization analysis of TFEB on SK-N-BE(2)-C cells treated for 24 h with vorinostat (500 nM) or panobinostat (10 nM). Chloroquine (50 µM) was used as positive control for TFEB translocation. GAPDH was used as cytoplasmic marker, HDAC2 was used as nuclear marker. (d) Quantification of nuclear TFEB by Western blot analysis from subcellular localization analysis. Statistical analyses: t-test. (e) Western blot analysis of pERK1/2 and ERK1/2 expression after 6 h and 24 h treatment with vorinostat (500 nM) or panobinostat (10 nM). Note that identical blots were used to analyze S6K1 phosphorylation in Figure 3a. |
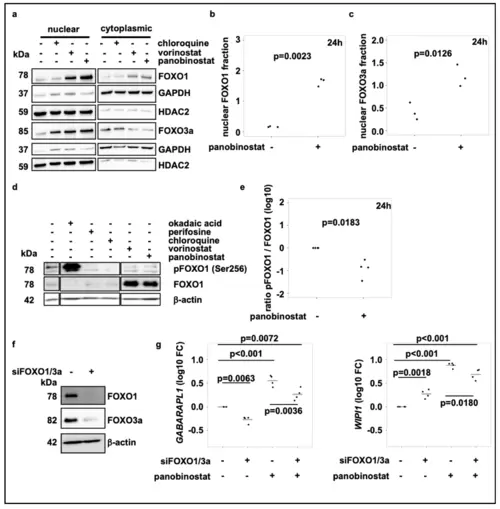
Broad-spectrum HDAC inhibitor treatment activates FOXO1 via the PI3K-AKT-pathway and induces FOXO nuclear translocation. (a) Representative subcellular localization analysis of FOXO1 and FOXO3a in SK-N-BE(2)-C neuroblastoma cells treated for 24 h with chloroquine (50 µM), vorinostat (500 nM) or panobinostat (10 nM) for 24 h. GAPDH was used as cytoplasmic marker, HDAC2 served as nuclear marker. (b,c) Quantification of FOXO1 (b) and FOXO3a (c) nuclear protein of at least three individual Western blots analogous to figure (a). (d) Western blot analysis of pFOXO1 and FOXO expression after treatment of SK-N-BE(2)-C cells with chloroquine (50 µM), vorinostat (500 nM) or panobinostat (10 nM) for 24 h. Okadaic acid (1 µM) and perifosine (5 µM) were used as positive and negative control, respectively. All samples were applied to the same gel and blotted on one membrane. Treatments with inhibitors/substances not relevant for the figure were cut from the analysis. (e) Quantification of the pFOXO1 to FOXO1 ratio from Western blot analysis from four individual experiments, normalized to solvent control. Statistical analyses: t-test. (f) Western blot analysis of FOXO1 and FOXO3a in SK-N-BE(2)-C neuroblastoma cells 5 days after transfection with control or FOXO1 and FOXO3a siRNA (pool of three different siRNAs for each target; pool of 6 siRNAs in total), respectively. (g) Realtime RT-PCR analysis of GABARAPL1 and WIPI1 after transfection of SK-N-BE(2)-C neuroblastoma cells with control or FOXO1 and FOXO3a siRNA (pool of 3 siRNAs for each target; pool of 6 siRNAs in total). Cells were additionally treated for the last 24h with either panobinostat or a solvent control. Statistical analyses: ANOVA with Tukey’s multiple comparison test. |
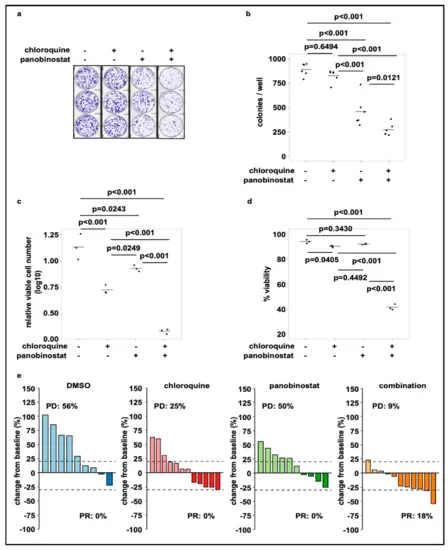
Treatment with panobinostat in combination with chloroquine reduces cell viability and colony growth. (a) Colony formation assay of SK-N-BE(2)-C neuroblastoma cells treated for 24 h with chloroquine (20 µM) or panobinostat (10 nM) alone or in combination. Shown are 6 technical replicates from two independent experiments. (b) Quantification of grown colonies after treatment of SK-N-BE(2)-C cells for 24 h with chloroquine (20 µM) or panobinostat (10 nM) alone or in combination. (c) Viable cell number (normalized to DMSO) of SK-N-BE(2)-C cells after 72 h treatment with chloroquine (20 µM) or panobinostat (10 nM) alone and in combination. (d) Viability of SK-N-BE(2)-C cells after 72 h treatment with chloroquine (20 µM) or panobinostat (10 nM) alone and in combination. (b–d) Statistical analyses: ANOVA with Tukey’s multiple comparison test. (e) Waterfall plots demonstrating change in tumor volume (%) for each individual xenograft, from baseline (day 1 = start of the treatment) to day 3 after yolk sac-implantation of SK-N-BE(2)-C cells. Dotted lines are drawn according to Response Evaluation Criteria in Solid Tumors (RECIST) 1.1 adopted for zebrafish tumors, to visualize best response: progressive disease (PD), at least a 20% increase in tumor volume; partial response (PR), at least a 30% decrease in tumor volume; each bar reflects one individual xenograft. The following concentrations were applied: chloroquine: 100 µM; panobinostat: 200 nM. |