
|
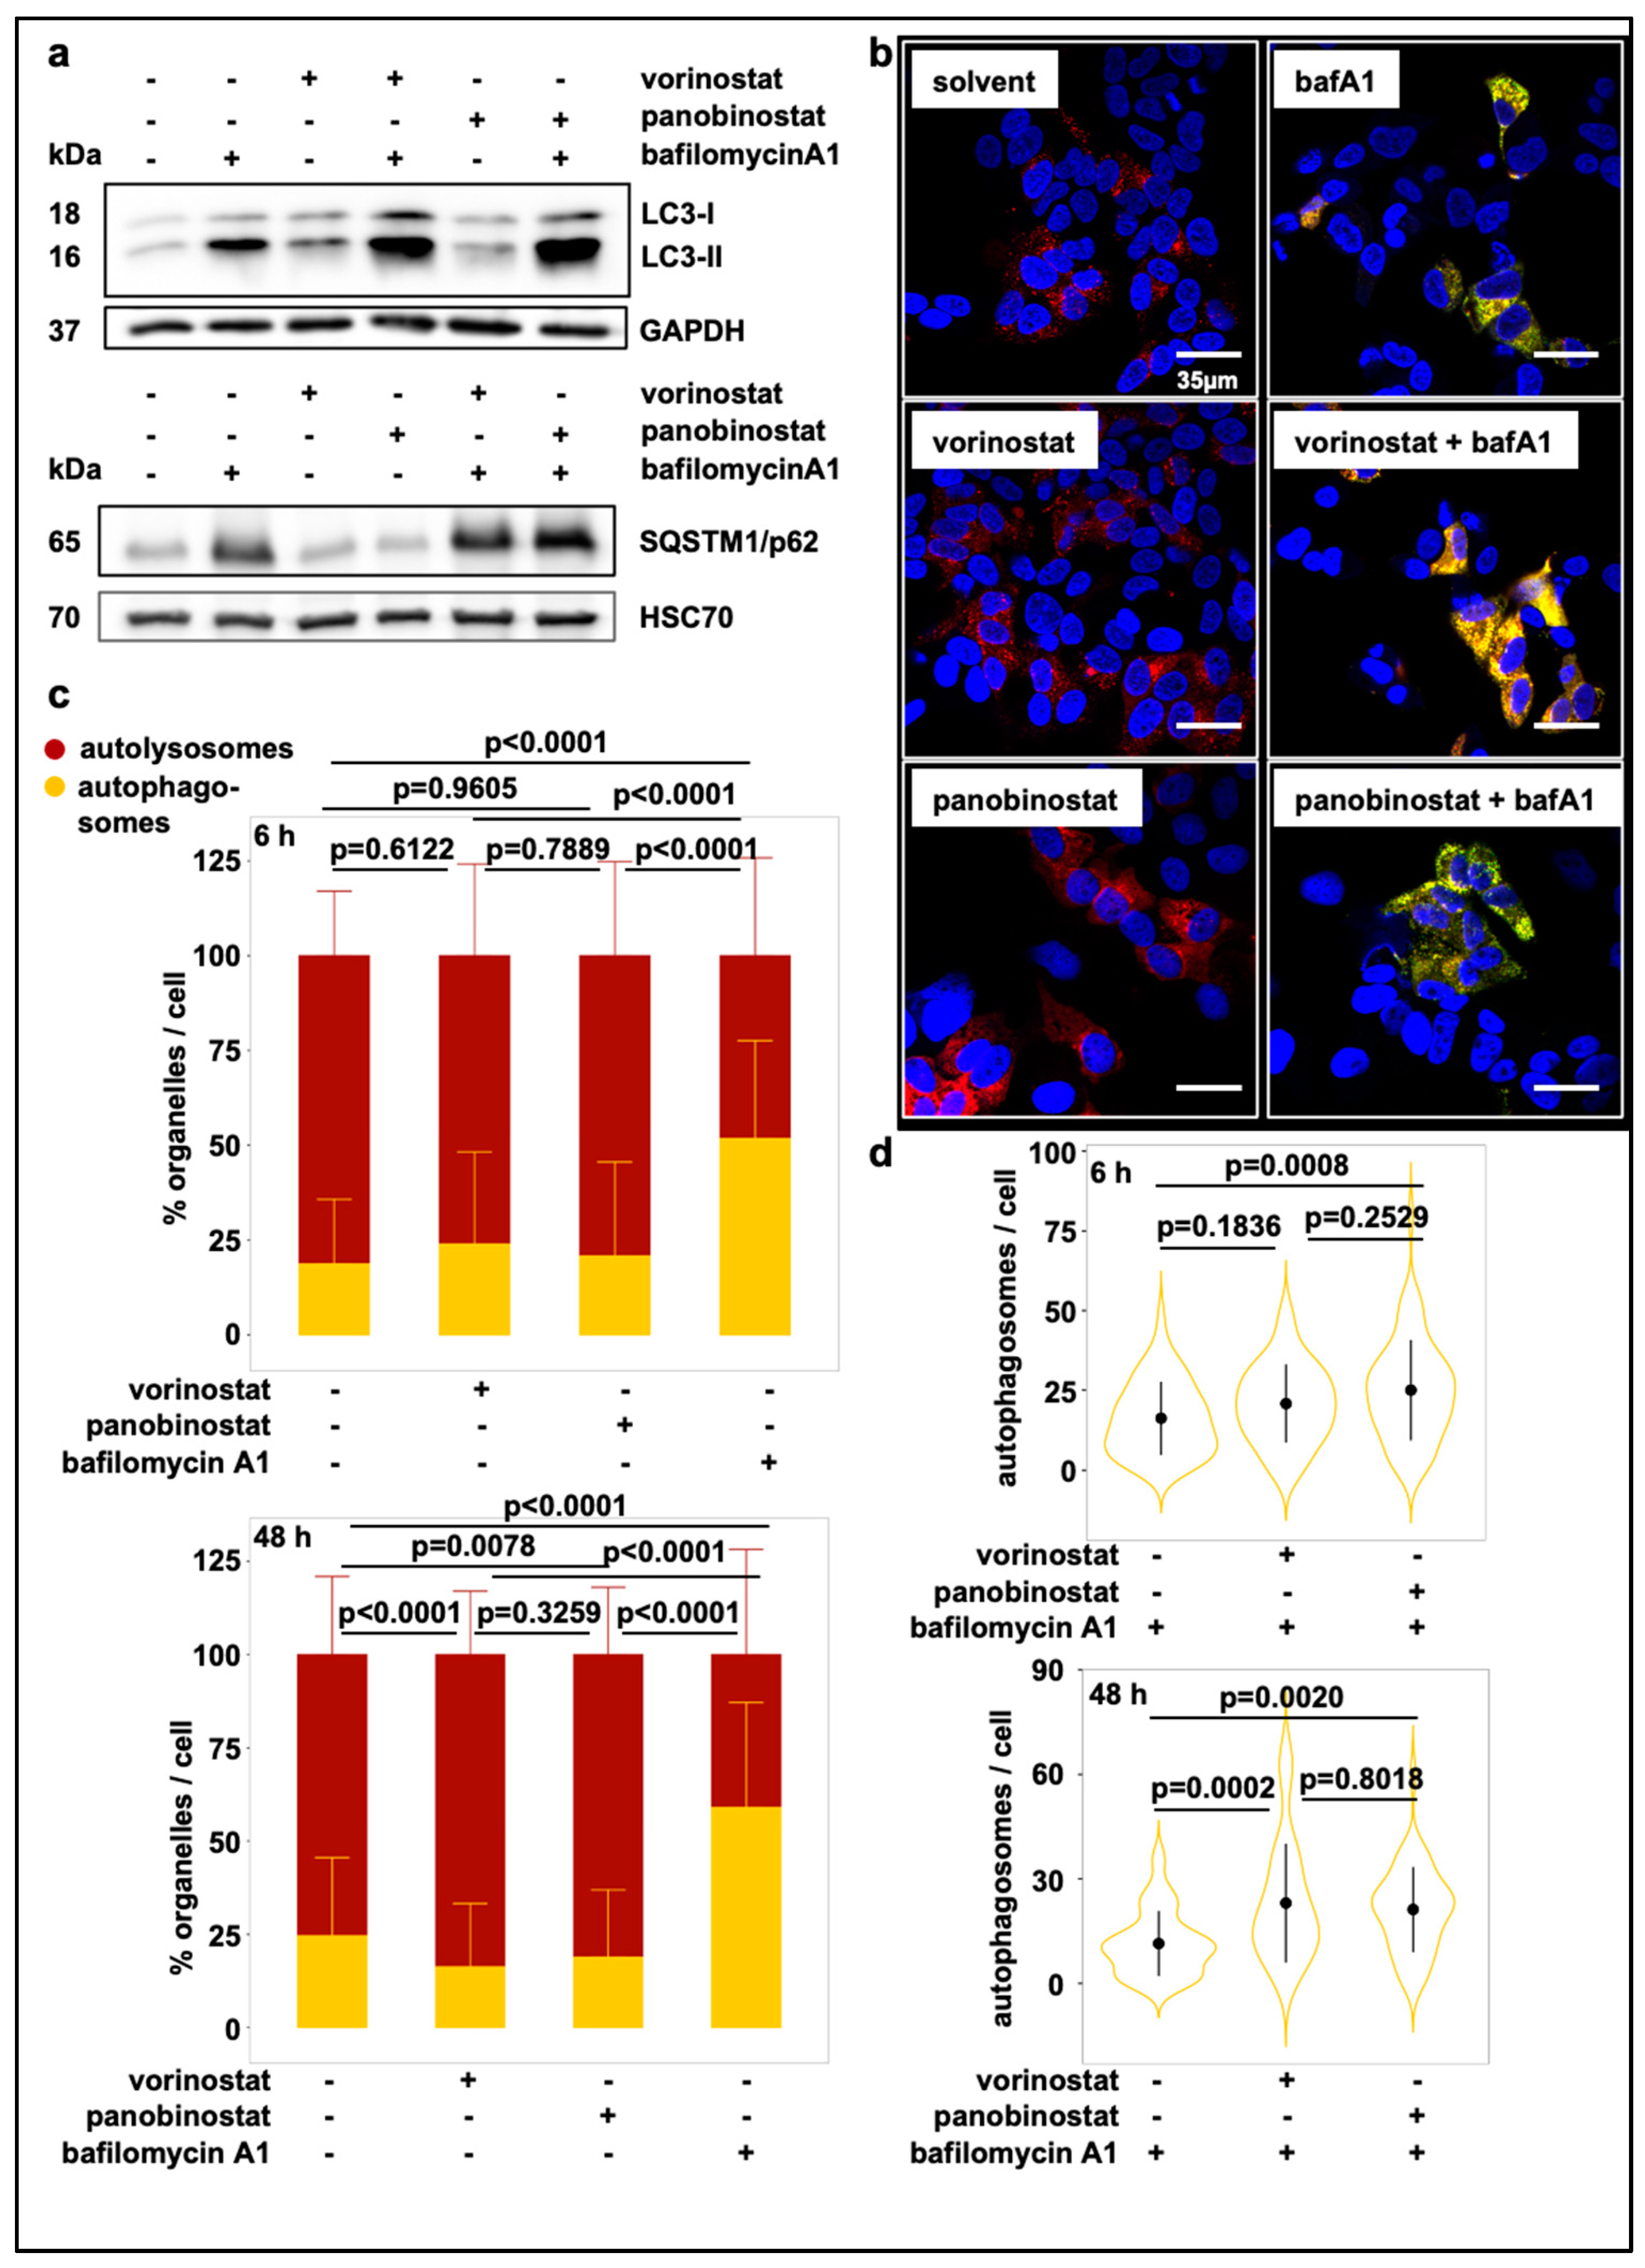
Fig. 1 Treatment with broad-spectrum HDAC inhibitors induces autophagic flux. (a) Western Blot displaying LC3-I and LC3-II levels and SQSTM1/p62 levels in whole-cell lysates of SK-N-BE(2)-C cells after 24 h treatment with 500 nM vorinostat or 10 nM panobinostat or solvent control and with or without additional 6h treatment with bafilomycin A1 (100 nM). GAPDH and HSC70 served as a loading control for corresponding Western blots. (b) Confocal fluorescence microscopy analysis of SK-N-BE(2)-C cells. Autophagosome formation was visualized after treatment with vorinostat (500 nM) or panobinostat (10 nM) alone or in combination with 100 nM bafilomycin A1 by using the mCherry-EGFP-LC3B expression construct. Autolysosomes appear red fluorescent only, autophagosomes are red and green fluorescent (yellow in merged channels). Scale bar: 35 µm. (c) Automated quantification of one representative fluorescence microscopic experiments using the mCherry-EGFP-LC3B expression construct 6 h and 48 h after treatment with either HDACi or bafilomycin A1. Each transfected cell was analyzed for green and red fluorescent foci. Statistical analyses: ANOVA with Tukey’s multiple comparison test. (d) Automated quantification and statistical analyses for the combination treatment with bafilomycin A1 as described in (c).