FIGURE SUMMARY
Title

uhrf1 and dnmt1 Loss Induces an Immune Response in Zebrafish Livers Due to Viral Mimicry by Transposable Elements

Authors
Magnani, E., Macchi, F., Madakashira, B.P., Zhang, C., Alaydaroos, F., Sadler, K.C.
Source
Full text @ Front Immunol

uhrf1 and dnmt1 loss causes DNA methylation loss in zebrafish livers. (A) Slot blot of genomic DNA extracted from pools of 5 dpf uhrf1−/− and dnmt1−/− mutant and WT siblings livers. (B) Quantification of 5-MeC measured by slot blot normalized to double stranded DNA (dsDNA). Each dot represents one clutch. *p < 0.05 and **p < 0.005 calculated by unpaired t-test. (C) Time course imaging of live larvae by fluorescent stereoscope microscopy. Tg(c269°ff ; 10XUAS:dsRed; fabp10a:GAL4; cmlc2:EGFP);dnmt1−/− and Tg(c269°ff; 10XUAS:dsRed; fabp10a:GAL4; cmlc2:EGFP);uhrf1−/− are shown at each age, showing the liver (dsRed), the heart (GFP) as a marker of transgenesis and, in green, the liver with DNA hypomethylation in mutants only. Images are representative of 100% of larvae from 3 clutches observed for each genotype.

dnmt1 and uhrf1 loss causes overexpression of retrotransposons. RNAseq analysis of Transposable Elements in uhrf1−/− and dnmt1−/− mutant livers. (A) MA plot showing log2 fold change of repetitive elements in dnmt1−/− livers calculated on WT siblings and Base Mean in WT siblings. Repetitive elements are divided by Class in DNA transposons (yellow), LTR (purple), LINE (light blue), SINE (blue), and other (gray). (B) MA plot showing log2 fold change of repetitive elements in uhrf1−/− livers calculated on WT siblings and Base Mean in WT siblings. Repetitive elements are divided by Class in DNA transposons (yellow), LTR (purple), LINE (light blue), SINE (blue), and other (gray). (C) Bar graph of Transposable Elements divided by class in uhrf1−/− and dnmt1−/− mutant livers. Upregulated TEs have log2 fold change > 0 and downregulated TEs have log2 fold change < 0. (D) Correlation plot of repetitive elements in uhrf1−/− and dnmt1−/− mutant livers. Upregulated TEs have adj as pedix < 0.05 and log2 fold change > 0; downregulated TEs have padj < 0.05 and log2 fold change < 0. Log2 fold change is calculated between mutants and their own WT siblings.

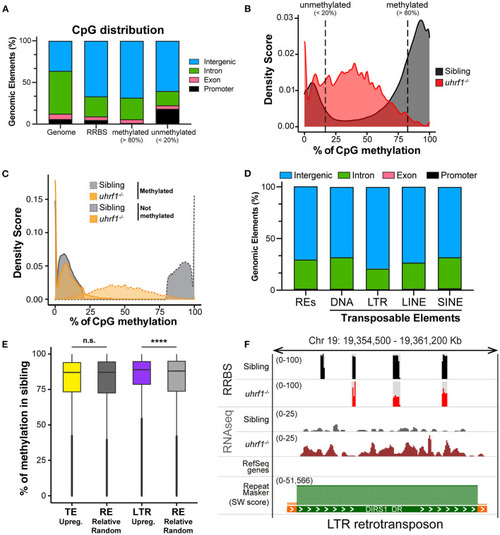
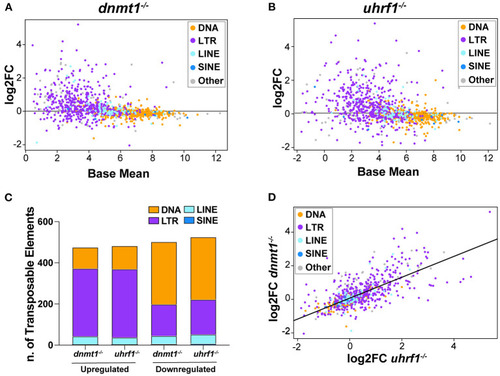
DNA methylation is enriched on TEs that become activated in uhrf1 mutants. RRBS analysis on genomic DNA of TEs in uhrf1−/− mutant larvae. (A) Genomic Annotation of all CpGs common to the unified dataset from uhrf1−/− mutants and WT siblings are divided by level of methylation in WT siblings in methylated (>80%; 616,305 CpGs) and unmethylated (< 20%; 212,750 of CpGs) and were then classified based on their location in annotated genomic element. (B) Density plot of percentage of methylation of CpGs in uhrf1−/− mutants and wild-type siblings. (C) Density plot CpGs in uhrf1−/− mutants and wild-type sibling. CpGs were classified based on the percentage of methylation in the sibling in methylated (>80%) (dashed gray line) and not methylated (< 20%) (solid gray line). For each group, methylation levels were plotted for both mutants (dashed orange line) and siblings (solid orange line). (D) Genomic annotation of CpGs covered in RRBS and overlapping with the TEs annotated in the RNAseq. (E) Box plot describing the percentage of methylation of CpGs in WT siblings: from left, CpGs contained in TEs upregulated (padj < 0.05 and log2 fold change > 0 in uhrf1−/−mutants–yellow) and in equal number of REs randomly selected (193,397 regions–dark gray); CpGs contained in LTRs upregulated (padj < 0.05 and log2 fold change > 0 in uhrf1−/−mutants–purple) and in equal number of REs randomly selected (30,353 regions–gray). ****p < 0.0001 calculated by unpaired non-parametric Mann–Whitney test. (F) Genome browser screenshot shows an example of RNA transposons (LTR retrotransposon, DIRS1_DR) that is demethylated and expressed in uhrf1−/− mutants. SW score is determined by Repeat Masker and it is used as indicator of the age of transposons. High SW score corresponds to highly conserved TEs, indicating younger TE.

dnmt1 and uhrf1 loss activates typeI interferon and NF-kB mediated immune response. (A) RNAseq analysis of RNA extracted from uhrf1−/− and dnmt1−/− mutant livers. Four quadrants plot of log2 fold change of uhrf1−/− and dnmt1−/− mutant livers calculated on their own WT siblings. The genes that are significant are indicated in red. Genes that are significant (padj < 0.05) in uhrf1−/− and dnmt1−/−, in yellow the genes significant only in dnmt1−/− mutants and in blue the one significant only in the uhrf1−/− mutant livers. (B) Gene Ontology of the upregulated and downregulated genes in each dataset. Significant genes (padj < 0.05) for each category in (A), are divided based on log2 fold change in upregulated (log2 Fold Change > 0) and downregulated (log2 Fold Change < 0). In red the GO terms involved in immune pathways and in green GO terms associated to metabolism and liver specific pathways. (C) Bar graph shows the 20 most significant positively induced pathways according identified in IPA. Pathways are ranked ordered based on z-score and it indicates the likelihood of activation based on comparison with a model that assigns random regulation directions. In red, the immune related pathways. (D) IPA analysis of Interferon pathway. The color of the circles represents the expected trend of the genes when the pathways is upregulated (pink for upregulated and green for downregulated), the color inside the circles represents the observed trend of that gene in our RNAseq. (E) IPA analysis of Tnfa pathway. The color of the circles represents the expected trend of the genes when the pathways is upregulated (pink for upregulated and green for downregulated), the color inside the circles represents the observed trend of that gene in our RNAseq. (F) Metaplot of the DNA methylation levels in WT siblings and uhrf1−/− mutants of the +/– 4 kb region surrounding the Transcription Start Site of the genes involved in Immune response pathways (GP006955) that are upregulated in the uhrf1−/−(padj < 0.05 and log2FC > 0, top panel) or not differentially expressed (padj > 0.05, bottom panel).

Viral signaling pathways are required for the gene expression and cell death phenotypes in uhrf1 mutants. (A) qPCR analysis of immune genes in uhrf1−/− and dnmt1−/− mutants compared to their WT siblings. Rplp0 is used as loading controls and the delta-delta Ct (DDCt) values were calculated by normalization to rplp0 and WT sibling controls for each individual clutch. Lines in the graph represents the median. Statistical significance is calculated by paired t-test. **p < 0.05, ***p < 0.005, ****p < 0.001. (B) qPCR performed on the livers from mavscr and stingcr F0 crispants in the uhrf1 and WT backgrounds to assess immune gene expression. DDCt is calculated after normalization of each gene to rplp0 and WT sibling controls for each clutch; this was performed for each crispants and for the not-injected embryos. Significance is calculated using 2-way Anova. *p < 0.05, **p < 0.01, ***p < 0.0005. (C) TUNEL analysis of uhrf1−/− and phenotypically WT sibling livers at 5 dpf in tnfacr F0 crispants and non-injected controls. Quantification of the number of TUNEL positive foci per total liver area for at least 3 livers per clutch in 4 clutches for each condition. Significance is measured by 2-way Anova test. **p < 0.05, ****p < 0.0001.

Acknowledgments
This image is the copyrighted work of the attributed author or publisher, and ZFIN has permission only to display this image to its users. Additional permissions should be obtained from the applicable author or publisher of the image. Full text @ Front Immunol