
- Title
-
A calcineurin-mediated scaling mechanism that controls a K+-leak channel to regulate morphogen and growth factor transcription
- Authors
- Yi, C., Spitters, T.W., Al-Far, E.A.A., Wang, S., Xiong, T., Cai, S., Yan, X., Guan, K., Wagner, M., El-Armouche, A., Antos, C.L.
- Source
- Full text @ Elife
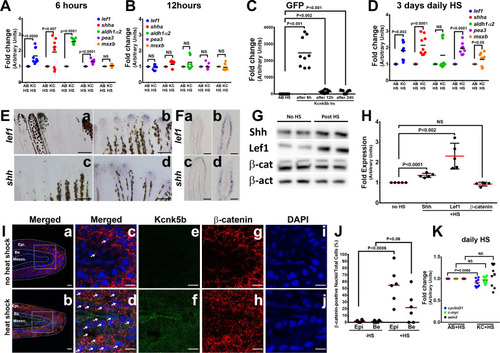
(A) qRT-PCR results of shh and lef1, aldh1α2, pea3, and msxb expression from caudal fins of 6-month-old wild-type (AB) and Tg[hsp70:kcnk5b-GFP] zebrafish 6 hr after heat shock (HS)of the caudal fins. (B) qRT-PCR results of shh and lef1, aldh1α2, pea3 and msxb expression from caudal fins of 6-month-old wild-type (AB) and Tg[hsp70:kcnk5b-GFP] zebrafish 12 hr after heat-shock induction of the the caudal fins. (C) qRT-PCR results for GFP from the transgenic fish line Tg[hsp70:kcnk5b-GFP] at the indicated time points relative to the single heat-shock pulse of AB wild-type and transgenic fish. AB HS for each time point were always set at onefold, so they are represented as only one group in the graph. (D) qRT-PCR results for several genes in the caudal fin from daily heat-shock pulse of AB wild-type and Tg[hsp70:knck5b-GFP] over 3 days. (E) In situ hybridization experiments on fins show expression of shh (a,b) and lef1 (c,d) in heat-shocked non-transgenic control fish (a,c) and heat-shocked Tg[hsp70:kcnk5b-GFP](b,d). (F) Cross-sections through fin rays show expression of lef1(a,b) and shh (c,d) before (a,c) and after (b,d) heat-shock induction of Tg[hsp70:kcnk5b-GFP]. (G) Representative images of Western blots show expression of Shh, Lef1 and β-catenin before and 3 days after 10 min daily heat-shock induction of kcnk5b-GFP in the fin. (H) Graphed measurements results of Western blots. (I) Confocal planes (0.45 μm) of immunohistochemistry stained 10 μm sections of control (no heat shock) or transgene-induced (heat shock) uninjured fins for merged GFP from Tg[hsp70:kcnk5b-GFP] and β-catenin (red) (a–d: Merged), GFP from Tg[hsp70:kcnk5b-GFP] (e,f: green) β-catenin (g,h: red) and DAPI (i,j: blue)of fin cross-sections of transgenic Tg[hsp70:kcnk5b-GFP] animals without heat shock (a,c,e,g,i) or after heat shock (b,d,f,h,j). White boxes in (a and b) show location of magnified panels of c,e,g and d,f,j, respectively. Overlapping DAPI and β-catenin staining indicated by white arrows. Epi.’ refers to the outer multilayered epidermis, ‘Be.’ as the underlying basal epithelial layer, and ‘Mesen.’ refers to the underlying mesenchymal tissues. (J) Graphed measurements of DAPI stained nuclei containing staining of β-catenin. (K) qRT-PCR results for the indicated genes in the caudal fin from AB non-transgenic and Tg[hsp70:knck5b-GFP] fish after daily heat-shock pulses over 3 days. Scale bars are 50 µm (D), 1 mm (E), 10 µm (H). The data for each experiment represent three or more separate experiments. The data points show all technical replicates. Student’s T-test used for the tests of significance between indicated experimental groups. |
( |
( |
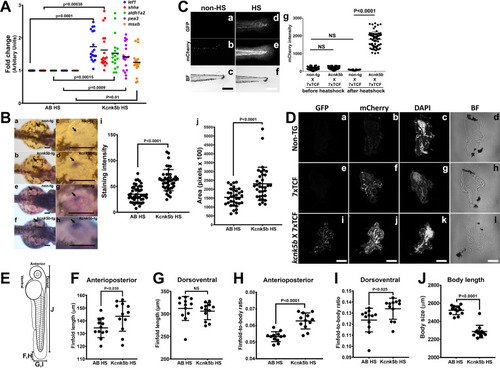
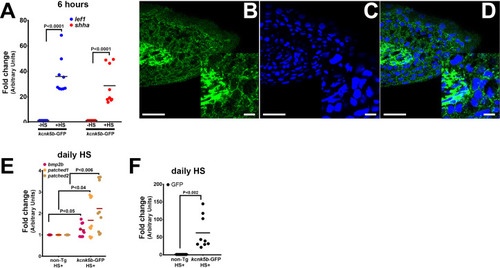
(Aa,b) Comparison of gene expression from mRNA isolated from complete three dpf zebrafish larva harboring Tg[hsp70:knck5b-GFP] 6 hr after heat-shock (HS) induction. (B) In situ hybridization experiments on 2 dpf embyros for shh start to detect expression in the cells of the zone of polarity in the early pectoral fin bud by 60 min of incubation of the final staining reaction (a–d) or after overnight staining (e–h). Measurements of shh expression levels by computer-program-based detection of pixel level intensities (i) or by the stained area (j) in the early pectoral fin bud. Panels c,d,g,h are enlarged regions (open black boxes) in panels a,b,e,f. Arrows indicate shh expression in the developing fin buds. (C) Double transgenic 3dpf larva harboring Tg[hsp70:kcn5b-GFP] and hemizygous Tg[7XTCF-Xla.sam:mCherry] either before heat shock (a–c) or 12 hr after heat shock (d–f). (Cg) Measurements of mCherry intensity levels of non-transgenic (non-tg), kcnk5b-transgenic (kcnk5b) fish and transgenic fish harboring the Lef-1-dependent Tg[7XTCF-Xla.sam:mCherry] reporter (7xTCF) before and 12 hr after heat shock. (D) Cross sections through the trunks of non-transgenic (a–d) and Tg[7XTCF-Xla.sam:mCherry] (e–h) and Tg[hsp70:kcn5b-GFP]; Tg[7XTCF-Xla.sam:mCherry] double-transgenic (i–l) fish lines after heat shock. (D) Measurements from dorsal to ventral of the caudal finfold of Tg[7XTCF-Xla.sam:mCherry] and Tg[7XTCF-Xla.sam:mCherry] X Tg[hsp70:kcnk5b-GFP] sibling larva after heat shock. (E) Diagram of the measurement axes of the larva. (F) Length measurements from anterior-most point of the caudal finfold to its distal-most tip of 5 dpf larva. (G) Length measurements of the caudal finfold from the dorsal-most point to the ventral-most tip of 5 dpf larva. (H) Finfold anterioposterior length-to-body ratios of the caudal finfold of 5 dpf larva. (I) Finfold dorsoventral length-to-body ratios of the body ratios. (J) Body length measurements of 5 dpf larva as diagramed in (E). Scale bars are 100 µm (B,C) and 20 µm (D). The data for each panel represent three or more experiments. The data points show all technical replicates. Student’s T-test used for all test of significance between the indicated experimental groups. |

( |

(A) Diagram of transplantation procedure and possible cell-autonomous and non-cell-autonomous outcomes on the expression of the Tg[7XTCF-Xla.sam:mCherry] Lef1 reporter after heat-shock induction of the Tg[hsp70:kcnk5b-GFP] transgene. (B) Transplantation experiments of donor cells from double transgenic fish harboring Tg[hsp70:kcnk5b-GFP] and Tg[7XTCF-Xla.sam:mCherry] into homozygous host embryos harboring only the Tg[7XTCF-Xla.sam:mCherry]. The head (a) eye (e) trunk (i) and finfold (m) of mosaic larva before heat shock induction of kcnk5b-GFP expression. Head (b–d), eye (f–h), trunk (j–l), and finfold (n–p) of 72 dpf larva at 24 hr after heat shock. (C) Bright field images of the head (a,d), jaw area (g) border tissue of otic vesicle (j) and trunk (o,r) of 72 hpf larva; GFP expression from Tg[hsp70:kcnk5b-GFP](b,e,h,k,p,s) and mCherry expression from Tg[7XTCF-Xla.sam:mCherry] (c,f,i,l,q,t). (D) Higher magnification of merged (a) and separate GFP (b) and mCherry (c) channels of cells in the neural tube of 48 hpf embryos. Z-stack composite three-dimensional images before rotation (d), rotated 90° (e) and 180° (f). (E) Total number of positive cells counted in the tissues of all mosaic larva for all mCherry-positive cells from recipient Tg[7XTCF-Xla.sam:mCherry] larva, all GFP-positive cells from Tg[hsp70:kcnk5b-GFP](open green triangle) and all double positive cells (open blue squares). The data for each experiment represent three or more experiments with two or more biological replicates. Scale bars are equal to 200 μm (Ba-l), 50 μm (Bm-p), 20 μm (C), and 25 μm (D). |
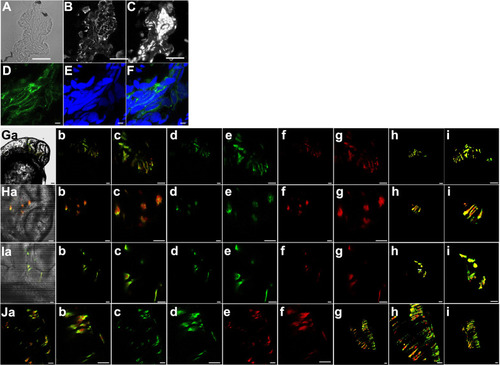
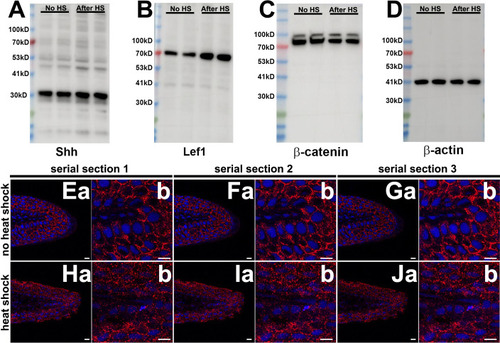
(A) Representative bright field cross-section through the mid-section of heat-shocked transgenic zebrafish 72 hpf larva. (B) Immunohistochemical staining for GFP of the same cross section in panel A. (C) DAPI staining of the same cross-section in panel A. (D) Representative confocal image of immunohistochemical staining for GFP in heat-shocked transgenic zebrafish larva showing membranous staining of Kcnk5b-GFP. (E) DAPI staining of the same confocal section in panel D. (F) Merged image of panels D and E. (Ga–i) Images of cells in the head 48 hpf embryos expressing kcnk5b-GFP transgene and mCherry from the 7XTCF-Xla.sam:mCherry transgene. (a) Bright fish image, (b) Merge of GFP and mCherry, (c) enlargement of (b), (d) GFP image, (e) enlargement of (d), (f) mCherry image, (g) enlargement of (f), (h) 3D composite of z-stacked images, (i) enlargement of (h). (Ha–i) Images of cells in the brain of 48 hpf embryos expressing kcnk5b-GFP transgene and mCherry from the 7XTCF-Xla.sam:mCherry transgene. (a) Bright fish image, (b) Merge of GFP and mCherry, (c) enlargement of (b), (d) GFP image, (e) enlargement of (d), (f) mCherry image, (g) enlargement of (f), (h) 3D composite of z-stacked images, (i) enlargement of (h). (Ia–i) Images of cells in the developing otic vesical of 48 hpf embryos expressing kcnk5b-GFP transgene and mCherry from the 7XTCF-Xla.sam:mCherry transgene. (a) Bright fish image, (b) Merge of GFP and mCherry, (c) enlargement of (b), (d) GFP image, (e) enlargement of (d), (f) mCherry image, (g) enlargement of (f), (h) 3D composite of z-stacked images, (i) enlargement of (h). (Ja–i) Images of cells in the developing neural tube of 48 hpf embryos expressing kcnk5b-GFP transgene and mCherry from the 7XTCF-Xla.sam:mCherry transgene. (a) Merge of GFP and mCherry, (b) enlargement of (a), (c) eGFP image, (d) enlargement of GFP image (c), (e) mCherry image, (f) enlargement of mCherry image (e), (g) 3D composite of z-stacked images, (h) enlargement of 3D composite (g), (i) 90° rotation of 3D composite of z-stacked images (g). Scale bars equal 40 µm (A–C), 5 µm (D–F), 20 μm (G–J). The data for each panel represents three or more experiments. |

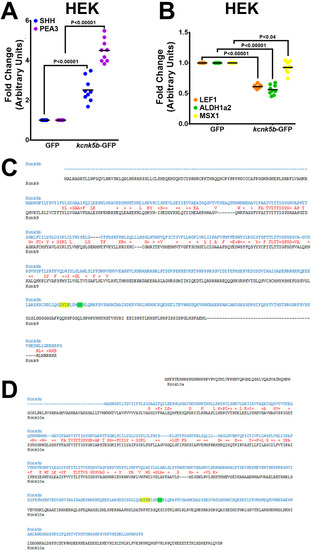
(A) FRET-FLIM images after measuring the life time of CFP of the K+ FRET reporter KIRIN (Shen et al., 2019). The color images indicate the differences in CFP fluorescence lifetime of the K+ FRET reporter KIRIN in HEK293T (HEK) cells. Assigned rainbow of colors in the delineated cytoplasm depict the range of numeric values of nanoseconds (ns) of the detected fluorescent lifetime for CFP. Red represents longer lifetime values. Blue represents shorter lifetime values, and the other colors represent intermediary lifetime values. (a) Composite image of all lifetime values of the KIRIN K+ reporter in control cells transfected with mCherry. (b) Image of low lifetime values in a control cell. (c) Image of high lifetime values in a control cell. (d) Composite image of all lifetime values of the KIRIN K+ reporter in cells expressing kcnk5b-mCherry. (e) Image of low lifetime values in cells expressing kcnk5b-mCherry. (f) Image of high lifetime values in cells expressing kcnk5b-mCherry. (g) Compared to GFP-transfected HEK cells, cells transfected with kcnk5b-mCherry show an increase in CFP lifetime due to reduction in intracellular K+. (Ba) qRT-PCR for SHH and LEF1 in HEK cells. (Bb) qRT-PCR for ALDH1a2, PEA3 and MSX1 in HEK cells. (C) qRT-PCR for indicated genes in HEK cells expressing GFP, kcnk9-GFP or kcnk10-GFP 24 hr after transfection. (D) qRT-PCR results in HeLa cells expressing either GFP or kcnk5b-GFP 24 hr after transfection. (E,F) qRT-PCR results in N2A cells expressing either GFP or kcnk5b-GFP 24 hr after transfection. (G) qRT-PCR results in Mcf7 cells expressing either GFP or kcnk5b-GFP 24 hr after transfection. (H,I) qRT-PCR measurement of indicated gene after 24 hr transfection of Kcnk9 in Hela cells. (J) qRT-PCR measurement of indicated gene after 24 hr transfection of Kcnk10 in HeLa cells. (K) qRT-PCR measurement of indicated gene after 24 hr transfection of Kcnk9 in N2A cells. (L) qRT-PCR measurement of indicated gene after 24 hr transfection of Kcnk10 in N2A cells. The data represent three or more experiments, The data points show all technical replicates. Student’s T-test was used for tests of significance and the levels of significance are indicated between the experimental groups. |

( |
( |
( |
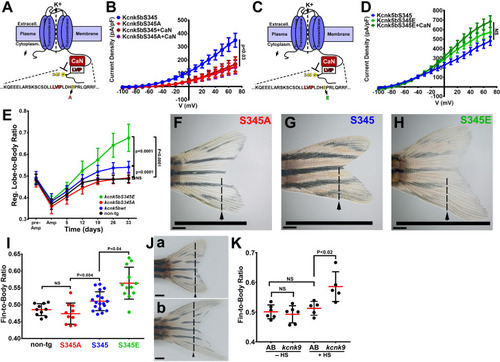
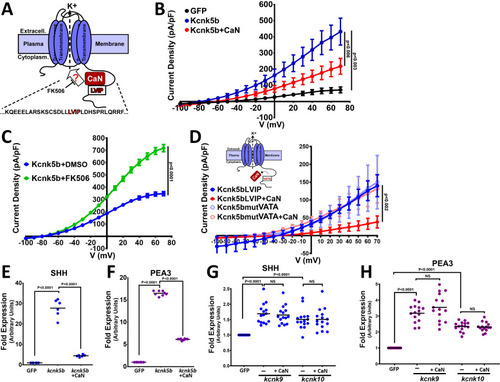
(A) Diagram of Kcnk5b channel showing proposed Serine345Proline346 calcineurin dephosphorylation site adjacent the calcineurin-interaction site (LVIP). Mutation of S345 to alanine (A) mimics dephosphorylation. (B) Whole-cell patch-clamp results of HEK239T (HEK) cells transfected with zebrafish wild-type channel (Kcnk5bS345) or the dephospho-mimic mutant (KcnkS345A) either with or without calcineurin (CaN). (C) Diagram of serine (S) to glutamic acid (E) substitution to mimic phosphorylation of Kcnk5b. (D) Whole-cell patch-clamp measurements for wild-type Kcnk5b and mutant Kcnk5b harboring a Serine345 to glutamic acid either with or without calcineurin (CaN). (E) Graph displays different growth rates of the regenerating caudal fin lobes of the indicated transgenic fish lines. Body length of each fish was used to standardize the fin length measurements (fin-to-body ratio). (F) Caudal fin of Tg[hsp70:kcnkbS345A] transgenic fish after regeneration of ventral lobe. (G) Caudal fin of Tg[hsp70:kcnk5bS345] transgenic fish after regeneration of ventral lobe. (H) Caudal fin of Tg[hsp70:kcnk5bS345E] transgenic fish after regeneration of ventral lobe. (I) Graph of fin-to-body ratios of the unamputated lobes of the indicated transgenic fish lines at 33 days of the same fish as in (F). (J) Representative caudal fins of the Tg[hsp70:kcnk9-GFP] fish that was allowed to regenerate without any heat-shock induction of the transgene (a) or underwent a daily 10 min heat-shock induction of the Tg[hsp70:kcnk9-GFP] transgene (b). (K) Assessment of regenerative fin growth at 33 dpa of the indicated fish lines and heat-shock treatment. The data for each experiment represent three or more experiments. The averaged data points in B,D,E represent two or more technical replicates per experiment. The graphed data in I,K show all technical replicates. The electrophysiology measurements (panels B,D) are represented as averages with SEM. Significance values shown in the graphs were measured by students t-tests (E, I, K) are represented as averages and SD. The scale bars equal 2 mm (F–H,Ja,b). Arrows and dashed lines in F-H,Ja,b indicate amputation planes through fins. |

(A) Diagram of Kcnk5b channel showing proposed Serine345 calcineurin dephosphorylation site (yellow) adjacent the calcineurin-interaction site (LVIP). Two other serines (blue) were substituted with alanines or glutamic acids to mimic dephosphorylation or phosphorylation. (B) Electrophysiology measurements of wild-type Kcnk5b (blue) and serine-to-alanine mutant Kcnk5bS330A (purple). (C) Electrophysiology measurements of wild-type Kcnk5b (blue) and serine-to-alanine mutant Kcnk5bS332A (yellow). (D) Electrophysiology measurements of wild-type Kcnk5b (blue) and serine-to-alanine mutant Kcnk5bS345A (orange). (E) Electrophysiology measurements of wild-type Kcnk5b (blue), serine-to-glutamic acid mutant Kcnk5bS330E (black), and Kcnk5bS330E plus calcineurin (CaN) (red). (F) Electrophysiology measurements of wild-type Kcnk5b (blue), serine-to-glutamic acid mutant Kcnk5bS332E (black), and Kcnk5bS332E plus calcineurin (CaN) (red). (G) Body length measurements from tip of the head to the base of the fin for each transgenic fish are represented as averages and standard deviation. (H) Body length measurements from tip of the head to the base of the fin for each fish of either wild-type (AB) or Tg[hsp70:kcnk9-GFP] (kcnk9) either without (–HS) or with (+HS) heat shock. The data for each experiment represent three or more experiments. The averaged data points in B-G represent two or more technical replicates per experiment. The data in H show all technical replicates. |
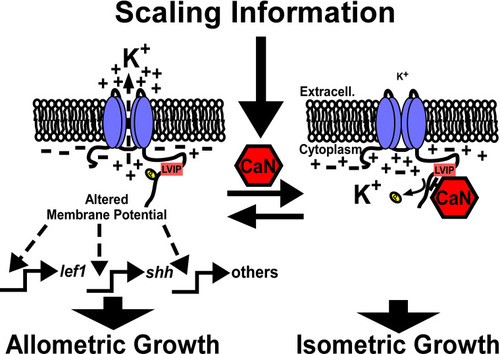
Kcnk5b activation results in reduced cytoplasmic K+, which is sufficient to induce the transcription of the |