
- Title
-
Possible Dietary Effects of Insect-Based Diets across Zebrafish (Danio rerio) Generations: A Multidisciplinary Study on the Larval Phase
- Authors
- Zarantoniello, M., Randazzo, B., Cardinaletti, G., Truzzi, C., Chemello, G., Riolo, P., Olivotto, I.
- Source
- Full text @ Animals (Basel)
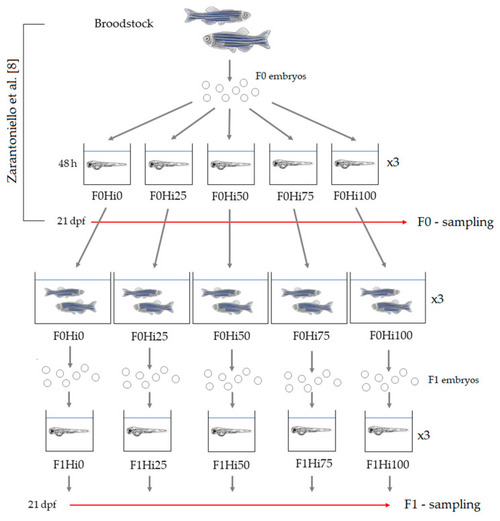
Schematic representation of the experimental design. Fish-fed diets including 0%, 25%, 50%, 75% and 100% of BSF meal respect to FM (F0Hi0, F0Hi25, F0Hi50, F0Hi75 and F0Hi100 for F0 zebrafish and F1Hi0, F1Hi25, F1Hi50, FiHi75 and F1Hi100 for F1 zebrafish larvae). dpf–days post fertilization; F0–parental generation; F1–first filial generation. |
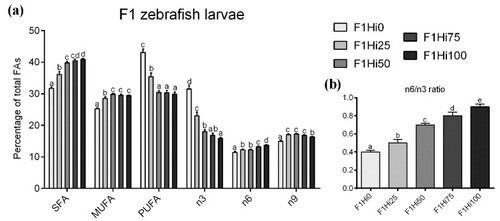
(a) Content of saturated fatty acid (SFA), monounsaturated fatty acid (MUFA) and polyunsaturated fatty acid (PUFA) (as % of total fatty acids ) and omega 3 (n-3), omega 6 (n-6), omega 9 (n-9) fatty acid contribution to lipid profile and (b) n6/n3 ratio of F1 zebrafish larvae fed the different experimental diets (F1Hi0, F1Hi25, F1Hi50, F1Hi75 and F1Hi100). a–e Different letters show statistically significant differences among experimental groups compared within the same FA class (p < 0.05). Values are reported as mean ± standard deviation (n = 3). |
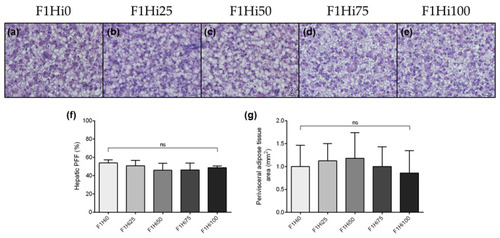
(a–e) Example of hepatic parenchima histomorphology, (f) percentage of fat fraction (PFF) in liver tissue and (g) perivisceral adipose tissue area (mm2) of F1 zebrafish larvae fed diets including 0%, 25%, 50%, 75% and 100% of BSF prepupae meal respect to FM (F1Hi0, F1Hi25, F1Hi50, F1Hi75 and F1Hi100 groups). Scale bars: 20 μm. For PFF and perivisceral adipose tissue area, values are shown as mean ± standard deviation (n = 15). ns: no significant differences. |
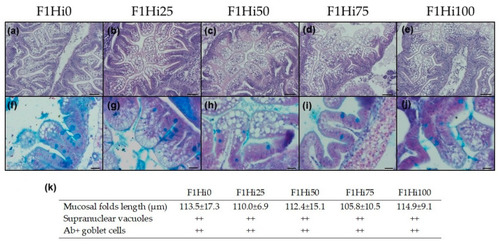
(a–j) Example of medium intestine histomorphology and (k) histological indexes (mucosal folds length, supranuclear vacuoles and Ab+ goblet cell abundance) measured in this gut tract of F1 zebrafish larvae fed diets including 0, 25, 50, 75 and 100% of BSF prepupae meal respect to fish meal (F1Hi0, F1Hi25, F1Hi50, F1Hi75 and F1Hi100 groups). Scale bars and staining: (a–e) 50 μm, H&E; (f–j) 20 μm, Ab. Letters: gc = Ab+ goblet cells. For histological indexes (k), values of mucosal folds length are shown as mean ± standard deviation (n = 15). Scores: supranuclear vacuoles + = scattered, ++ = abundant; Ab+ goblet cells + = 0 to 3 per villus, ++ = 4 to 6 per villus, + + + = more than 6 per villus. No significant differences were detected among the experimental groups. |
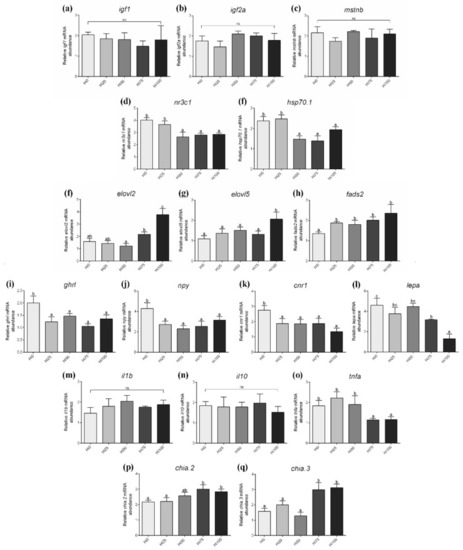
Relative mRNA abundance of genes analyzed in F1 zebrafish larvae fed diets including 0%, 25%, 50%, 75% and 100% of BSF prepupae meal respect to FM (F1Hi0, F1Hi25, F1Hi50, F1Hi75 and F1Hi100 groups). (a) igf1, (b) igf2a, (c) mstnb, (d) nr3c1, (e) hsp70.1, (f) elovl2, (g) elovl5, (h) fads2, (i) ghrl, (j) npy, (k) cnr1, (l) lepa, (m) il1b, (n) il10, (o) tnfa, (p) chia.2 and (q) chia.3. a–c Different letters specify statistically significant differences among experimental groups (p < 0.05). Values are shown as mean ± standard deviation (n = 5). ns: no significant differences. |