
- Title
-
Black Soldier Fly (Hermetia illucens) Larvae and Prepupae Defatted Meals in Diets for Zebrafish (Danio rerio)
- Authors
- Lanes, C.F.C., Pedron, F.A., Bergamin, G.T., Bitencourt, A.L., Dorneles, B.E.R., Villanova, J.C.V., Dias, K.C., Riolo, K., Oliva, S., Savastano, D., Giannetto, A.
- Source
- Full text @ Animals (Basel)
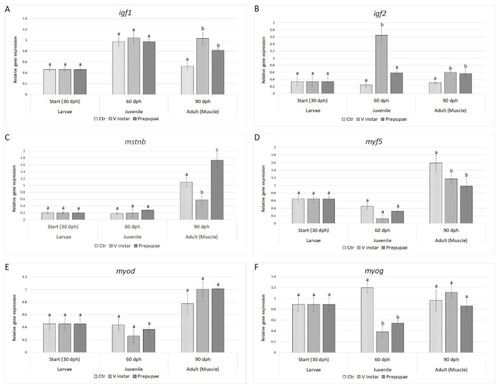
Expression profiles of genes involved in growth: (A) igf1, (B) igf2, (C) mstnb, (D) myf5, (E) myod, and (F) myog. Relative mRNA levels were evaluated in zebrafish larvae (30 dph), juveniles (60 dph), and adults (90 dph) fed with V instar and prepupae diets compared to controls fed with a diet containing fishmeal as the main protein source. Data are expressed as mean ± S.D. (n = 6). Different letters indicate significant differences in transcript levels among experimental groups within the same sampling time (p < 0.05). |
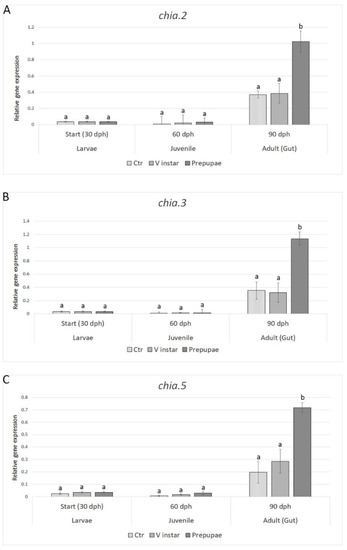
Expression profiles of genes associated with chitin hydrolysis: (A) chia.2, (B) chia.3, and (C) chia.5. Relative mRNA levels were evaluated in zebrafish larvae (30 dph), juveniles (60 dph), and adults (90 dph) fed with V instar and prepupae diets compared to controls fed with a diet containing fishmeal as the main protein source. Data are expressed as mean ± S.D. (n = 6). Different letters indicate significant differences in transcript levels among experimental groups within the same sampling time (p < 0.05). |

Expression profiles of genes involved in immune response (A) il1b, (B) il6, and (C) tnfα. Relative mRNA levels were evaluated in zebrafish larvae (30 dph), juveniles (60 dph), and adults (90 dph) fed with V instar and prepupae diets compared to controls fed with a diet containing fishmeal as the main protein source. Data are expressed as mean ± S.D. (n = 6). Different letters indicate significant differences in transcript levels among experimental groups within the same sampling time (p < 0.05). |
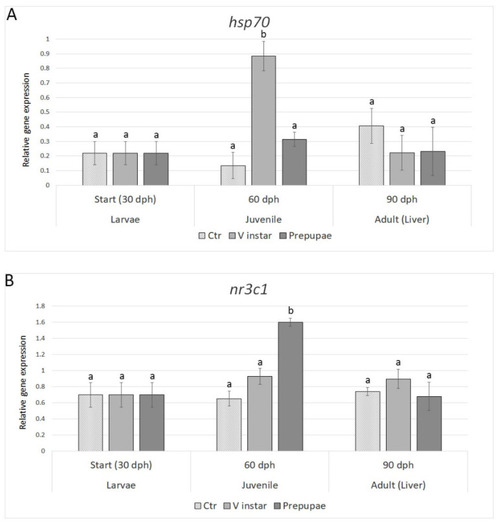
Expression profiles of stress-related genes (A) hsp70 and (B) nr3c1. Relative mRNA levels were evaluated in zebrafish larvae (30 dph), juveniles (60 dph), and adults (90 dph) fed with V instar and prepupae diets compared to controls fed with a diet containing fishmeal as the main protein source. Data are expressed as mean ± S.D. (n = 6). Different letters indicate significant differences in transcript levels among experimental groups within the same sampling time (p < 0.05). |