
Image
|
Figure Caption
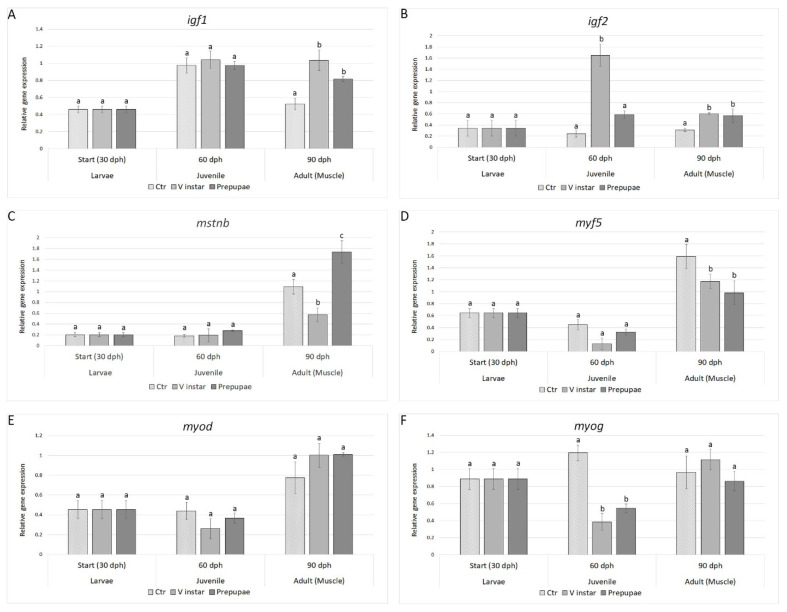
Figure 1 Expression profiles of genes involved in growth: (A) igf1, (B) igf2, (C) mstnb, (D) myf5, (E) myod, and (F) myog. Relative mRNA levels were evaluated in zebrafish larvae (30 dph), juveniles (60 dph), and adults (90 dph) fed with V instar and prepupae diets compared to controls fed with a diet containing fishmeal as the main protein source. Data are expressed as mean ± S.D. (n = 6). Different letters indicate significant differences in transcript levels among experimental groups within the same sampling time (p < 0.05).
Acknowledgments
This image is the copyrighted work of the attributed author or publisher, and
ZFIN has permission only to display this image to its users.
Additional permissions should be obtained from the applicable author or publisher of the image.
Full text @ Animals (Basel)