
- Title
-
Ca2+-Dependent Glucose Transport in Skeletal Muscle by Diphlorethohydroxycarmalol, an Alga Phlorotannin: In Vitro and In Vivo Study
- Authors
- Yang, H.W., Jiang, Y.F., Lee, H.G., Jeon, Y.J., Ryu, B.
- Source
- Full text @ Oxid Med Cell Longev

Evaluation of toxicity of DPHC by assessment of survival rate and measurement of blood glucose level in zebrafish. The zebrafish were treated with various concentrations of DPHC from Ishige okamurae. (a) Survival curves of zebrafish embryos after exposure to DPHC (n= 15 for each group). (b) Diagram and (c) result for blood glucose level of zebrafish injected with DPHC and metformin for 90 min. Data are expressed as the ( for each group). ,#Values having different superscripts are significantly different at *p<0.05, **p<0.01, and ***p<0.0001 compared with the no sample-treated group; ####p<0.0001 compared with the nontreated group. PHENOTYPE:
|

Determination of cell viability by the MTT assay in the myotubes. (a) Myotubes were incubated with the indicated concentrations of DPHC for 24 h. (b) Myotubes were starved in serum-free media and incubated for 24 h with DPHC (3, 10, and 30 μM) and 2-NBDG (50 μM). Detection of cytosolic Ca2+ levels using the Fluo-4 calcium indicator in the myotubes. Myotubes were loaded with Fluo-4 in PSS in the (c) presence or (d) absence of Ca2+ and treated with control (PSS only), 30 μM of DPHC, or BAPTA-AM. Box plots representation of (e) the cytosolic Ca2+ levels in myotube responses after 30 μM of DPHC or BAPTA-AM treatment as presented in (c) and (d). Data are expressed as the mean± SE , n = 3 per group, *p<0.05 compared with the nontreated group. N.S.: no significance compared with the DPHC in the presence or absence of extracellular Ca2+. |
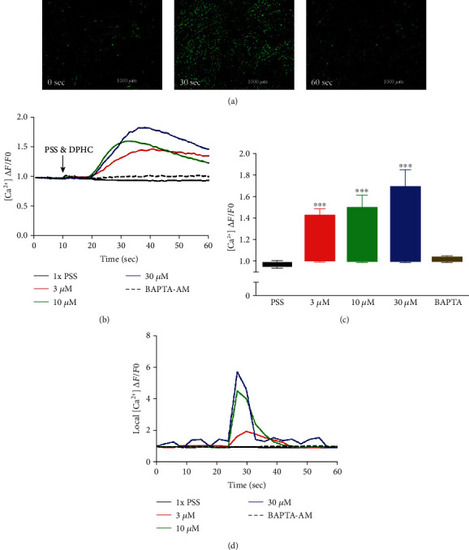
Detection of cytosolic Ca2+ levels in the absence of extracellular Ca2+ using the Fluo-4 indicator in the myotubes. (a) Representative images of myotubes at time zero (0 sec) and after stimulation with 30 μM of DPHC at time 30 sec and 60 sec. (b) Traces and (c) box plot representation of Ca2+ levels in response to addition of DPHC or BAPTA-AM in myotubes. The fluorescence levels of single myotubes after addition of DPHC or BAPTA-AM was also monitored (d). *p<0.05 and **p<0.001 compared with the PSS group. |

Detection of cytosolic Ca2+ changes using the Fluo-4 in zebrafish larvae. (a) Zebrafish larvae were stimulated with only DPHC (1.2, 6, and 12 μM). (b) Zebrafish larvae were stimulated with DPHC in Fluo-4 and compared with/without Fluo-4 groups. Changes in cytosolic Ca2+ levels were measured by changes in fluorescence intensity of Fluo-4 using ImageJ. (c) Measurement of blood glucose level in zebrafish. Zebrafish were injected with BAPTA-AM (3 μg/g body weight) for 1 h, after which the zebrafish were injected with DPHC (0.3 μg/g body weight) for 90 min. Experiments were performed in triplicate, and the data are expressed as the mean± SE, n = 4 per group. *,#Values having different superscripts are significantly different at ****p<0.0001 compared with the no sample-treated group; ##p<0.01 and ####p<0.0001 compared with the nontreated group. |

Expression of (a) Glut4 in zebrafish muscle tissues by immunofluorescence. Analysis of (b) Glut4, (c) AMPK, and (d) Akt signaling pathway in zebrafish muscle tissues by western blotting. The muscle extract was analyzed by western bottling, and the signal intensities were examined by the Fusion FX7 acquisition system (Vilber Lourmat, Eberhardzell, Germany). Experiments were performed in triplicate, and the data are expressed as mean± SE, n = 4 per group. ,#Values having different superscripts are significantly different at *p<0.05, **p<0.01, ***p<0.001, and ****p<0.0001 compared with the no sample-treated group; ##p<0.01 and ####p<0.0001 compared with the nontreated group. N.S.: no significance compared with the BAPTA-AM group. |

Measurement of (a) troponin C, (b) troponin I, (c) CaMKII, and (d) ATP levels in zebrafish muscle tissues. Zebrafish were injected with BAPTA-AM (3 |