
- Title
-
Bioorthogonal mRNA labeling at the poly(A) tail for imaging localization and dynamics in live zebrafish embryos
- Authors
- Westerich, K.J., Chandrasekaran, K.S., Gross-Thebing, T., Kueck, N., Raz, E., Rentmeister, A.
- Source
- Full text @ Chem Sci
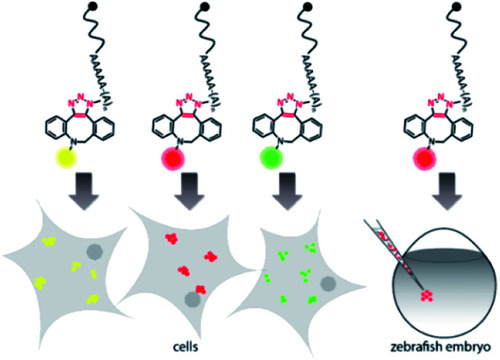
Concept of visualizing bioorthogonally labeled mRNAs in mammalian cells (left) or zebrafish embryos.15 Reporter-mRNAs were labeled at the 3′ poly(A) tail using azido-ATP and strain-promoted azide–alkyne cycloaddition with DBCO-fluorophores |
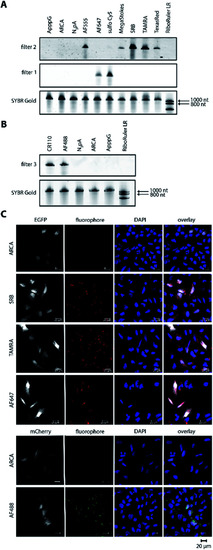
Bioorthogonal labeling of mRNAs at the poly(A) tail with different fluorophores enables their visualization in HeLa cells. (A) PAGE analysis of egfp mRNAs labeled with indicated fluorophores or controls (ApppG, ARCA, N3pA). (B) PAGE analysis of mcherry mRNAs labeled with indicated DBCO-fluorophores or controls. (7.5% PA gel, 20 W, 2.5 h, rt; filter 1: ≥575 nm, filter 2: ≥665 nm, filter 3: ≥510 nm). (C) Confocal microscopy of HeLa cells transfected with egfp or mcherry mRNA with indicated labels. Signals (red or green dots) from the fluorophores, EGFP/mCherry and DAPI channels enabled visualization of mRNA, EGFP/mCherry and nuclei, respectively. Scale bar = 20 μm. |
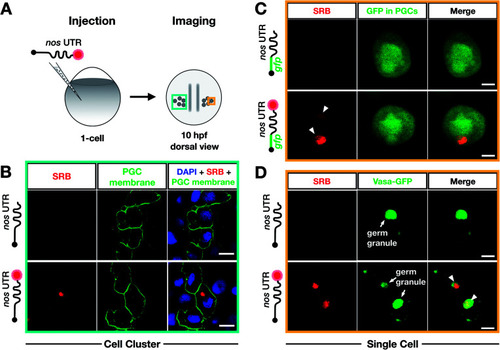
Bioorthogonal labeling with DBCO-SRB reveals subcellular localization of mRNA injected into zebrafish embryos without interfering with transcript positioning and translation. (A) 1-cell stage zebrafish embryos were injected with mRNA containing the PGC-specific nos 3′ UTR synthesized in vitro, which was either not labeled or labeled with SRB (red circle). PGCs were imaged 10 hpf, focusing either on a cell cluster (as in B) or on single cells (as in C and D). (B) Injection of SRB-labeled-mRNA containing a non-translatable mcherry sequence upstream of nos 3′ UTR (STOP mcherry-nos) results in specific detection of the transcript in cells expressing the transgenic PGC membrane marker egfp-f′ nos (lower panels), while non-labeled mRNA is not visible (upper panels). An overlay of the two detection channels and DAPI (labeling the nuclei) is presented in the right panels. Scale bar = 10 μm. (C) Injection of gfp-nos mRNA results in GFP-expression in PGCs (as in ref. 69, upper panels). SRB-labeling of the mRNA does not interfere with PGC-specific GFP-expression and results in detection of granule-like mRNA structures (arrowheads, lower panels). An overlay of the detection channels is presented in the right panels. Scale bar = 5 μm. (D) Co-injection of SRB-labeled STOP mcherry-nos mRNA with mRNA encoding for the germ granule marker protein Vasa GFP (arrows, Fig. S7†), reveals the localization of labeled STOP mcherry-nos transcripts to germ granules in PGCs (arrowheads, lower panels). Non-labeled mRNA is not visible (upper panels). An overlay of the detection channels is presented in the right panels. Scale bar = 5 μm. |

Labeling with DBCO-SRB does not alter the subcellular localization of injected mRNA and allows resolving the dynamic positioning of the transcript. (A) 1-cell stage embryos were injected with in vitro synthesized mRNA containing a non-translatable mcherry sequence upstream of nos 3′ UTR (STOP mcherry-nos mRNA). The injected mRNA was either not labeled (upper panels) or labeled (lower panels) with SRB (emission 610 nm). After 10 hpf, the embryos were fixed and hybridized with RNAscope probes, targeting the mcherry sequence (labeling the injected mRNA, emission filter 509 nm) and that of nanos open reading frame (labeling the endogenous nanos mRNA, emission filter 647 nm). An overlay of the three detection channels and DAPI (labeling the nuclei, emission filter 470) is presented in the right panels. (B) SRB-labeled gfp-nos mRNA was injected into 1-cell stage zebrafish embryos and tracked over time in PGCs after 1 day of development. The panels show maximum intensity projections spanning 9 μm, with time intervals of 3.5 seconds between frames. Lines highlight changes in distance (μm) between the edges of two RNA-containing structures over time. Changes in the shape of an RNA-containing structure (marked by an asterisk) are presented in the insets on the bottom left of each plane. Scale bar = 5 μm. |
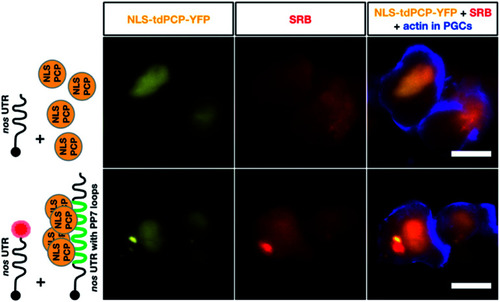
Co-detection of nos 3′ UTR-containing mRNA employing two different RNA labeling systems for live imaging in vivo. The same transcript type was visualized using click chemistry-based labeling and the PP7 detection system. To visualize nos 3′ UTR-containing mRNA using click chemistry, 1-cell stage embryos were injected with in vitro synthesized STOP mcherry-nos mRNA, which was either not labeled (upper middle panel) or labeled (lower middle panel) with SRB (red circle). To simultaneously detect nos 3′ UTR-containing mRNA using the PP7 detection system, in vitro synthesized mRNA encoding for the PP7 coat protein (NLS tdPCP-YFP) was injected either alone (upper left panel) or together with nos 3′ UTR-containing mRNA that bears a sequence of 24 loops in its 3′ UTR region, to which multiple copies of the coat protein can bind (nanos-nos 24xPP7 mRNA, lower left panel). PGCs were visualized by additional injection of a PGC-specific mRNA encoding for the actin marker protein Lifeact-tagBFP-nos. Scale bar = 10 μm. |