FIGURE SUMMARY
Title

The adapter protein Myd88 plays an important role in limiting mycobacterial growth in a zebrafish model for tuberculosis

Authors
Hosseini, R., Lamers, G.E.M., Bos, E., Hogendoorn, P.C.W., Koster, A.J., Meijer, A.H., Spaink, H.P., Schaaf, M.J.M.
Source
Full text @ Virchows Arch

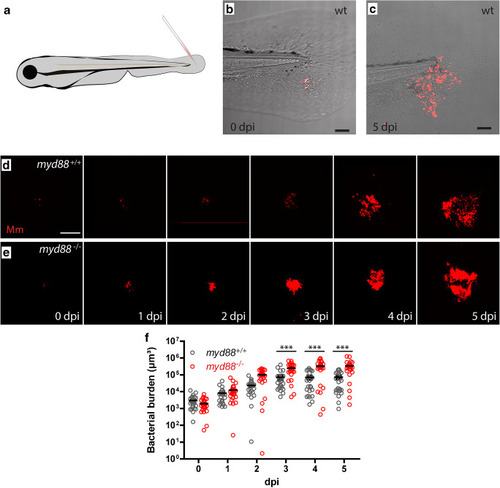
Granuloma development and morphology in the tail fin of zebrafish larvae. aMm injection in the tail fin generates single granuloma. b,c Infected tail fin of the same larva with fluorescently labelled Mm (red) at 4 h post infection (b) and at 4 days post infection (c) showing the localized development of the early granuloma structures. d,e Representative images of larvae showing the increase of Mm infection (red) and development of granuloma structures in the wild type (d) and myd88-/- larvae (e). f Bacterial burden in the myd88+/+ (black) and myd88-/- (red) larvae. The data (mean ± SEM) were analysed using analysis of variance (ANOVA); Bonferroni’s multi comparison post-test was performed on myd88 wild type and mutant larvae at each time point (***p < 0.0001, n > 20 larvae per time point). The scale bars represent 100 μm

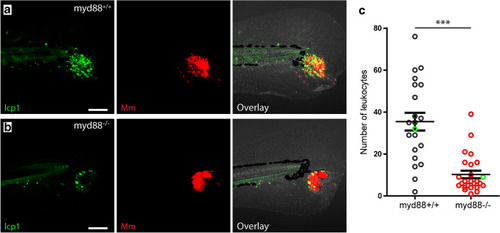
Number of leukocytes at the site of infection in myd88+/+ and myd88-/- larvae. a,b Representative images of a larva showing lcp1-positive cells (green) and Mm (red) in myd88+/+ (a) and myd88-/- (b) larvae at 4 dpi. c Quantification of lcp1-positive cell shows less leukocytes to be present at the site of infection in myd88-/- larvae. The data (mean ± SEM) were analysed using a two-tailed student t test (***p < 0.001, n > 20 larvae per condition). Scale bar represents 100 μm

TUNEL-positive cells at the site of infection in myd88+/+ and myd88-/- larvae. a,b Representative images of a larva showing TUNEL-positive cells (green) and Mm (red) in myd88+/+ (a) and myd88-/- (b) larvae at 4 dpi. c Quantification of TUNEL-positive cell shows fewer dead cells to be present at the site of infection in myd88-/- larvae. The data (mean ± SEM) were analysed using a two-tailed student t test (***p < 0.001, n > 20 larvae per condition). Scale bar represents 100 μm

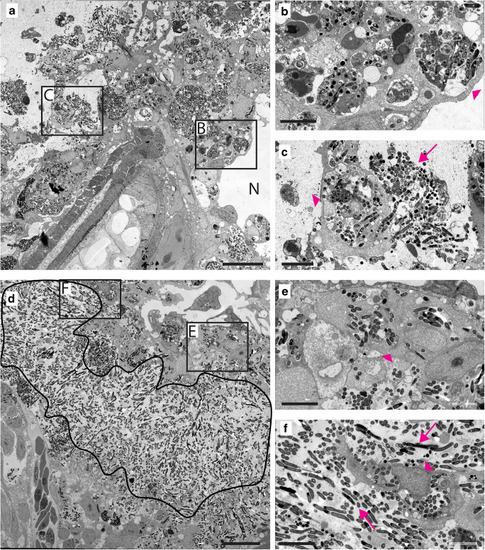
Granuloma structures in myd88-/- larvae consist mainly of extracellular Mm. a TEM image of a granuloma in representative myd88+/+ larvae, showing the necrotic centre (N) and aggregates of Mm in the immune cells. b,c Higher magnification of regions indicated in (a), showing infected cells (arrowheads) and extracellular Mm (arrows). d TEM image of a granuloma in representative myd88-/- larvae showing the area with extracellular Mm (black line). e,f Higher magnification of region indicated in (d), showing extracellular bacteria and infected cells (arrowheads). n = 3 per group, the scale bars in (a)–(d) (20 μm) and in (b)–(c) and (e)–(f) (10 μm)

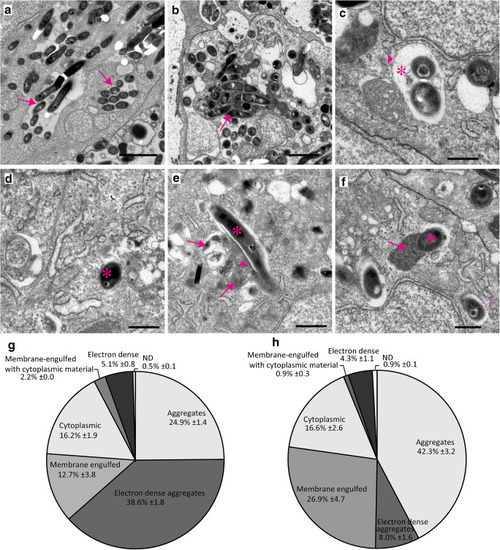
Quantification of intracellular Mm shows altered distribution of bacteria in different compartments in myd88-/- larvae. a–f Representative TEM images of Mm in different compartments. a Aggregates as a compact cluster of bacteria (> 5) without any electron-dense areas (arrows). b Electron-dense aggregates as a compact cluster of bacteria in a compartment having a uniform high electron density between the bacteria (arrowhead) and/or electron-dense regions (arrow). c Membrane-engulfed compartments containing bacteria surrounded by a single membrane (arrowhead) with an electron-transparent zone (asterisk), without any cytoplasmic material. d Cytoplasmic bacteria not enclosed by a membrane, indicated by a white asterisk. e Membrane-engulfed compartments with cytoplasmic material containing bacteria (asterisk), and partially degraded content (arrowhead) and other fused vacuoles (arrows). f Electron-dense compartments containing bacteria (asterisk) with uniform electron-dense content (arrow). g,h The fractions (± SEM) of intracellular Mm found in different compartments or free in the cytoplasm is presented in a pie chart for myd88+/+ (total is 2178 bacteria) (g) and myd88-/- (total is 1655 bacteria) (h). N is 3 larvae with initial stage granulomas per group at 4dpi, with the section at middle of granuloma were imaged and analysed for each larva. The scale bars in (a)–(b) (2 μm) and in (c)–(f) (500 nm)

Acknowledgments
This image is the copyrighted work of the attributed author or publisher, and ZFIN has permission only to display this image to its users. Additional permissions should be obtained from the applicable author or publisher of the image. Full text @ Virchows Arch