
- Title
-
Characterization of quinoxaline derivatives for protection against iatrogenic-induced hearing loss
- Authors
- Zallocchi, M., Hati, S., Xu, Z., Hausman, W., Liu, H., He, D.Z., Zuo, J.
- Source
- Full text @ JCI Insight
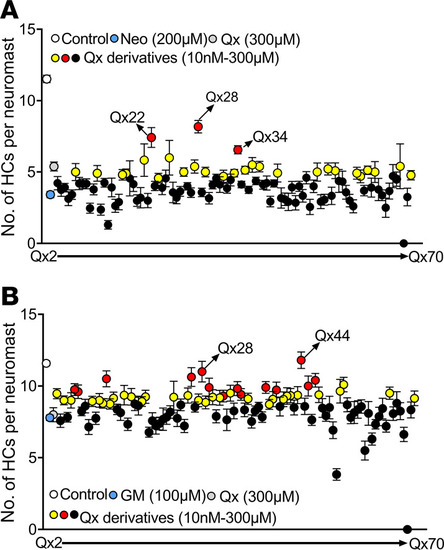
Screening of quinoxaline derivatives. Five dpf Tg(brn3c:GFP) zebrafish were preincubated with quinoxaline (Qx, 300 μM) or its derivatives (Qx2–Qx70, 10 nM–300 μM) for 1 hour, followed by coincubation with neomycin (Neo) 200 μM for 30 minutes (A) or gentamicin (GM) 100 μM long-term effect (B). Hair cells were quantified employing a Zeiss AxioSkop 2 fluorescence microscope with a 40× oil objective. White dot, vehicle; blue dot, ototoxin alone; gray dot, quinoxaline 300 μM. Black dots, quinoxaline derivatives that did not show any significant differences compared with ototoxin alone. Yellow dots, quinoxaline derivatives that performed significantly better than ototoxin alone but not significantly different from quinoxaline treatment. Red dots, quinoxaline derivatives that performed significantly better than quinoxaline treatment. Results were expressed as mean ± SEM. Statistical analysis: 1-way ANOVA with correction for Dunnett’s multiple comparisons test. Significance was set at P < 0.05 versus ototoxin or quinoxaline. Six fish were used per treatment, and 3 neuromasts were inspected per fish (n = 18). PHENOTYPE:
|
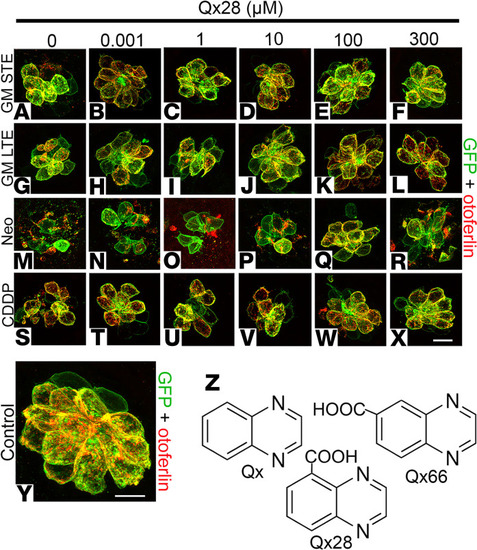
Qx28 treatment in neuromast hair cells. Representative images of 5 dpf Tg(brn3c:GFP) zebrafish pretreated with Qx28 (1 nM–300 μM) followed by coincubation with the different ototoxins. (A–F) Short-term effect (STE) of gentamicin 100 μM for 1 hour followed by 1-hour recovery in E3 water. (G–L) Long-term effect (LTE) of gentamicin 100 μM for 1 hour followed by 5-hour recovery in E3 water. (M–R) Neomycin 200 μM for 30 minutes followed by 1-hour recovery in E3 water. (S–X) CDDP 400 μM for 6 hours followed by 1-hour recovery. (Y) Vehicle control neuromast. GFP shown in green, otoferlin shown in red. Neuromasts were imaged employing a Zeiss LSM 800 confocal microscope with a 63× oil objective and Airyscan function. Scale bars: 7 μm (A–X), 5 μm (Y). (Z) Chemical structure of Qx, Qx28, and Qx66. For sample numbers see legend of Figure 3. PHENOTYPE:
|
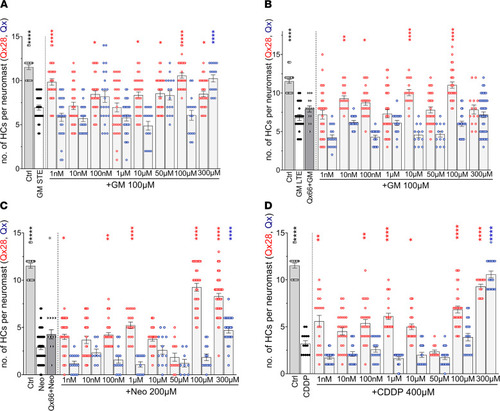
Qx28 protects from aminoglycoside- and CDDP-induced hair cell death. Quantification of the number of hair cells per neuromasts after the different ototoxin treatments in the presence or absence of quinoxaline (Qx, blue dots) or Qx28 (red dots). (A) Short-term gentamicin exposure (100 μM). (B) Long-term gentamicin exposure (100 μM). (C) Neomycin exposure (200 μM). (D) CDDP exposure (400 μM). Qx66 50 μM was included to show that although it has a similar structure as Qx28, it does not protect. Results are expressed as mean ± SEM. Statistical analysis: 1-way ANOVA with correction for Dunnett’s multiple comparisons test. *P < 0.05, **P < 0.01, ****P < 0.0001 versus ototoxin alone (blue asterisks, quinoxaline treatment; red asterisks, Qx28 treatment). Neuromasts inspected: vehicle = 20; GM-STE: GM alone = 29; GM+Qx28 = 29 (1 nM, 300 μM), 31 (10 nM–100 μM); GM+Qx = 25 (1 nM–100 nM), 30 (1 μM), 16 (10 μM–300 μM). GM-LTE: GM alone = 22; GM + Qx66 = 15; GM+Qx28 = 30 (1 nM, 1 μM, 50 μM, 100 μM), 17 (10 nM, 10 μM), 25 (100 nM), 14 (300 μM); GM+Qx = 17 (1 nM–1 μM, 100 μM), 12 (10 μM, 50 μM), 42 (300 μM). Neo: Neo alone = 44; Neo+Qx66 = 11; Neo+Qx28 = 28 (1 nM, 100 μM), 22 (10 nM, 100 nM, 10 μM), 18 (1 μM), 13 (50 μM), 34 (300 μM); Neo+Qx = 4 (1 nM, 100 nM, 10 μM, 100 μM), 9 (10 nM, 50 μM), 12 (1 μM), 24 (300 μM). CDDP: CDDP alone = 14; CDDP + Q28 = 19 (1 nM, 1 μM), 27 (10 nM, 100 nM), 23 (10 μM), 10 (50 μM), 32 (100 μM), 14 (300 μM); CDDP+Qx = 19 (1 nM–100 nM, 50 μM–300 μM), 13 (1 μM), 15 (10 μM). PHENOTYPE:
|

Antibiotic efficacy in the presence of Qx28. (A–F) There were no significant differences in the bacterial growth–inhibitory areas between aminoglycoside alone (C and E) (10 μg/mL) or Qx28 at the highest concentration (100 μM) (D and F). Filters soaked in PBS (A) or Qx28 alone (B) did not show any inhibitory properties. Quantification of the inhibitory area (G) is expressed as mean ± SEM (n = 9 for GM, n = 7 for the additional conditions). Two-tailed Student’s t test analysis between aminoglycoside alone or in combination with Qx28. Scale bar: 6 mm. |

Hair cell activity in the presence of Qx28. (A–I) Five dpf WT larvae were preincubated in E3 water without (A and B) or with different Qx28 concentrations (C–I) for 1 hour and then cotreated with FM1-43 3 μM for 20 seconds. (J) The fluorescence incorporated per neuromast (red) was measured using ImageJ (NIH) and expressed as a percentage from control. The orbiter line (B) (52, 53) and fish preincubated with BAPTA were used as negative controls. Phalloidin counterstaining is shown in green. Results are expressed as mean ± SEM. Statistical analysis: 1-way ANOVA with correction for Dunnett’s multiple comparisons test. *P < 0.05, ****P < 0.0001 versus control. Number of neuromasts quantified: control = 33, orbiter = 8, BAPTA = 14, Qx28 1 nM = 12, Qx28 10 nM = 9, Qx28 100 nM = 30, Qx28 1 μM = 17, Qx28 10 μM and 50 μM = 10, Qx28 100 μM = 20. Scale bar: 7 μm. (K) Means ± SEM of the magnitude of microphonic responses from 6 dpf zebrafish in the presence of vehicle or Qx28 100 μM. Statistical analysis: Student’s 2-tailed t test. ****P < 0.0001 versus control. Measurements were obtained from 1 neuromast per fish from a total of 6 fish per condition. Top right: Microphonic potential traces of 6 dpf zebrafish in the presence of vehicle or Qx28 100 μM. The orbiter line was used as a negative control. PHENOTYPE:
|
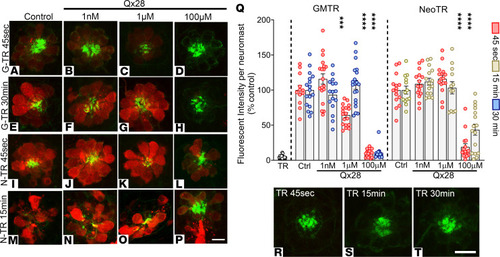
AG uptake in the presence of Qx28. Five dpf zebrafish were incubated with Texas Red–conjugated AG (AGTR) in the absence or presence of Qx28 (1 nM–100 μM). AGTR incorporation was followed over time. (A–H) Fish incubated for 45 seconds (A–D) or 30 minutes (E–H) with 50 μM of Texas Red–conjugated gentamicin (GMTR) in E3 media alone (A and E) or with Qx28 1 nM (B and F), 1 μM (C and G), or 100 μM (D and H). (I–P) Fish incubated for 45 seconds (I–L) or 15 minutes (M–P) with 100 μM of Texas Red conjugated neomycin (NeoTR) in E3 media alone (I and M) or with Qx28 1 nM (J and N), 1 μM (K and O), or 100 μM (L and P). Fish were counterstained with phalloidin (green). (Q) The fluorescence intensity incorporated was calculated using ImageJ and expressed as a percentage from the corresponding control without Qx28. (R–T) Texas Red (TR) incubation for 45 seconds (R), 15 minutes (S), or 30 minutes (T). Results are expressed as mean ± SEM. Statistical analysis: 1-way ANOVA with correction for Dunnett’s multiple comparisons test. ***P < 0.01, ****P < 0.0001 versus the corresponding control. Number of neuromasts quantified per treatment: GMTR 45 seconds = 12 (alone), 18 (+Qx28 1 nM, 1 μM), 16 (+Qx28 100 μM); GMTR 30 minutes = 17 (alone), 16 (+Qx28 1 nM), 20 (+Qx28 1 μM), 13 (+Qx28 100 μM); NeoTR 45 seconds = 15; NeoTR 15 minutes = 12 (alone, +Qx28 1 μM), 15 (+Qx28 1 nM), 16 (+Qx28 100 μM). Scale bars: 8 μm (A–P), 9 μm (R–T). PHENOTYPE:
|

Qx28 protects mammalian hair cells from gentamicin- and CDDP-induced ototoxicity. (A–H) P3 cochlear mouse explants were incubated for 48 hours at 37°C with media (A), Qx28 1mM (B), and the ototoxins alone (C and E) or in combination with Qx28 (10 nM–1 mM) (D and F–H). Tissue was immunostained for myosin VI (red). Two hundred micrometer regions from the middle turn were photographed, and the number of intact outer hair cells (OHCs) in each 30 inner hair cells was counted (G and H). Results are expressed as mean ± SEM. Statistical analysis: 1-way ANOVA with correction for Dunnett’s multiple comparisons test. *P < 0.05, **P < 0.01, ***P < 0.001, and ****P < 0.0001 versus the corresponding ototoxin. Number of independent replicates: n = 4 (GM 100 μM, GM+Qx28 10 μM–1 mM, CDDP 8 μM, CDDP+Qx28 100 μM, 1 mM), n = 3 (additional treatments). Scale bar: 20 μm. |

Qx28 modulates NF-κB canonical pathway. Representative immunoblots and quantitative data for IκBα. MEFs were treated for 16 hours with the indicated compounds, then processed for Western blot analysis. Membranes were stripped and reprobed for β-actin as a loading control. TNF-α (10 ng/mL) was used as a positive control for NF-κB canonical pathway activation. Quantification of the bands was performed using ImageJ. Results are expressed as mean ± SEM from 3 independent experiments. Statistical analysis: 2-tailed Student’s t test, *P < 0.05, **P < 0.01, ****P < 0.0001 versus the corresponding ototoxin alone. TNF-α treatment was compared with Qx28 10 μM treatment. Cartoon: signaling molecules involved in the NF-κB canonical pathway. |

Qx28 modulates p65 nuclear translocation. Representative images of MEFs treated for 16 hours with the indicated compounds: (A–C) media, (D–F) Qx28 10 μM, (G–I) TNF-α 10 ng/mL for 30 minutes (positive control), (J–L) gentamicin (GM) 150 μM, (M–O) GM+Qx28, (P–R) neomycin (Neo) 250 μM, (S–U) Neo+Qx28, (V–X) CDDP 50 μM, (Y–AA) CDDP+Qx28. Cells were immunostained for p65 (green) and counterstained with phalloidin (red). Asterisks denote nuclear translocation. n = 2 independent experiments. Scale bar: 55 μm. |

Reduction of IκKβ expression protects against aminoglycoside- and CDDP-induced ototoxicity. (A–O) Tg(brn3c:GFP) zebrafish eggs were noninjected (A–E) or injected with a suboptimal dose (2 ng) of scrambled (F–J) or ikbkb morpholinos (MO) (61) (K–O). At 3 dpf animals were incubated with gentamicin (GM) 100 μM STE (B, G, and L) or LTE (C, H, and M), neomycin (Neo) 200 μM (D, I, and N), or CDDP 400 μM (E, J, and O). Animals were fixed and immunostained for GFP. The number of hair cells per neuromast was quantified (P). Results are expressed as mean ± SEM. Statistical analysis: 1-way ANOVA with correction for Dunnett’s multiple comparisons test. **P < 0.01; ***P < 0.001; ****P < 0.0001 versus the corresponding control within the group (black asterisks). Two-tailed Student’s t test. *P < 0.05; **P < 0.01 versus identical treatment in scrambled animals (red asterisks). Number of neuromasts inspected: control = 8 (noninjected), 12 (scrambled MO), 10 (IκKβ MO); GM-STE = 7 (noninjected), 5 (scrambled), 4 (ikbkb MO); GM-LTE = 7 (noninjected, scrambled), 12 (ikbkb MO); Neo = 6 (noninjected, ikbkb MO), 5 (scrambled); CDDP = 9 (noninjected), 3 (scrambled), 12 (ikbkb MO). Scale bar: 6 μm. PHENOTYPE:
|

Qx28 protects hair cells by NF-κB pathway inhibition in vivo. Five dpf Tg(NFKB:EGFP) were treated with E3 water (A and B), Qx28 1 nM (C and D), TNF-α 20 ng/mL 30 minutes (positive control) (E and F), gentamicin (GM) 100 μM 30 minutes without (G and H) or with (I and J) Qx28, neomycin (Neo) 200 μM 5 minutes without (K and L) or with (M and N) Qx28, and CDDP 400 μM 2 hours without (O and P) or with (Q and R) Qx28. Animals were transferred to E3 water for 2 hours and immunostained for GFP (green) and otoferlin (red). The green fluorescence intensity was quantified using ImageJ and expressed as percentage from control (T). (S) Cartoon depicting a neuromast (top view): hair cells are in red, supporting cells are in gray, and mantle cells are in green. Results are expressed as mean ± SEM. Statistical analysis: 2-tailed Student’s t test, **P < 0.01, ***P < 0.001, ****P < 0.0001 versus ototoxin alone (black asterisks). One-way ANOVA with correction for Dunnett’s multiple comparisons test. **P < 0.01; ***P < 0.001; ****P < 0.0001 versus vehicle (red asterisks). Number of neuromasts quantified: n = 13 (control, CDDP), 11 (Qx28, GM), 3 (TNF-α), 15 (GM+Qx28), 9 (Neo), 20 (Neo+Qx28), 18 (CDDP+Qx28). Scale bar: 9 μm. PHENOTYPE:
|