
|
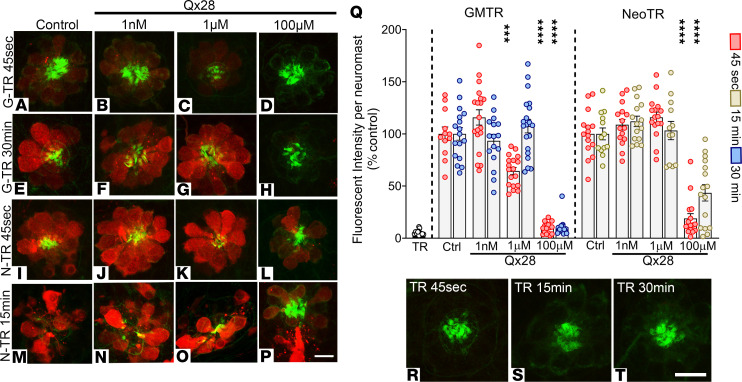
Figure 6 AG uptake in the presence of Qx28. Five dpf zebrafish were incubated with Texas Red–conjugated AG (AGTR) in the absence or presence of Qx28 (1 nM–100 μM). AGTR incorporation was followed over time. (A–H) Fish incubated for 45 seconds (A–D) or 30 minutes (E–H) with 50 μM of Texas Red–conjugated gentamicin (GMTR) in E3 media alone (A and E) or with Qx28 1 nM (B and F), 1 μM (C and G), or 100 μM (D and H). (I–P) Fish incubated for 45 seconds (I–L) or 15 minutes (M–P) with 100 μM of Texas Red conjugated neomycin (NeoTR) in E3 media alone (I and M) or with Qx28 1 nM (J and N), 1 μM (K and O), or 100 μM (L and P). Fish were counterstained with phalloidin (green). (Q) The fluorescence intensity incorporated was calculated using ImageJ and expressed as a percentage from the corresponding control without Qx28. (R–T) Texas Red (TR) incubation for 45 seconds (R), 15 minutes (S), or 30 minutes (T). Results are expressed as mean ± SEM. Statistical analysis: 1-way ANOVA with correction for Dunnett’s multiple comparisons test. ***P < 0.01, ****P < 0.0001 versus the corresponding control. Number of neuromasts quantified per treatment: GMTR 45 seconds = 12 (alone), 18 (+Qx28 1 nM, 1 μM), 16 (+Qx28 100 μM); GMTR 30 minutes = 17 (alone), 16 (+Qx28 1 nM), 20 (+Qx28 1 μM), 13 (+Qx28 100 μM); NeoTR 45 seconds = 15; NeoTR 15 minutes = 12 (alone, +Qx28 1 μM), 15 (+Qx28 1 nM), 16 (+Qx28 100 μM). Scale bars: 8 μm (A–P), 9 μm (R–T).