
- Title
-
Inhibition in growth and cardiotoxicity of tris (2-butoxyethyl) phosphate through down-regulating Wnt signaling pathway in early developmental stage of zebrafish (Danio rerio)
- Authors
- Xiong, H., Huang, Y., Mao, Y., Liu, C., Wang, J.
- Source
- Full text @ Ecotoxicol. Environ. Saf.

Fig. 1. Survival rate (A), malformation rate (B), hatching rate (C), heart rate (D) and typical malformations (E) of zebrafish larvae exposed to various concentrations of TBOEP (0, 20, 200, 1000 and 2000 μg/L) for 120 hpf. Values are presented as the mean ± SEM. Each group included 3 replicates (10 larvae/replicate). Significant differences among groups were indicated by different letters over the bars. |
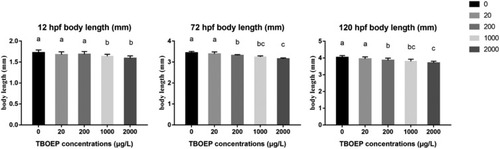
Fig. 2. Body length of zebrafish epibolies/larvae at 12 hpf (A), 72 hpf (B) and 120 hpf (C) after exposure to various concentrations of TBOEP (0, 20, 200, 1000 and 2000 μg/L). Values are presented as the mean ± SEM of 3 replicates (10 larvae/replicate). Significant differences among groups were indicated by different letters over the bars. |

Fig. 3. Gene expression in zebrafish embryos/larvae exposed to various concentrations of TBOEP (0, 20, 200, 1000 and 2000 μg/L) for different time points. Significant differences between control and treatment groups were checked by ANOVA and Turkey's test. |
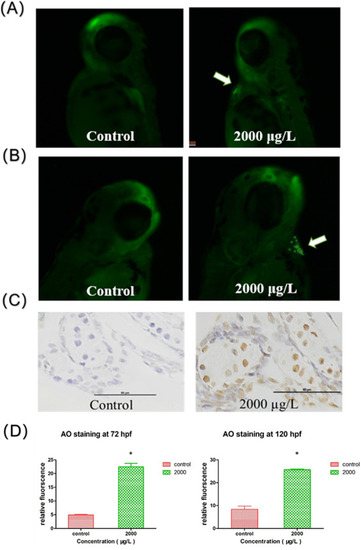
Fig. 4. Apoptosis analysis. Zebrafish larvae were stained with AO staining and TUNEL assay. Apoptosis, shown by white arrowheads, was detected around heart region by AO staining at 72 hpf (A) and 120 hpf (B). Apoptosis was also detected in heart area by TUNEL assay at 120 hpf (C). Quantitative analysis of apoptosis in AO staining was measured. Significant differences among groups were indicated by *p < 0.05 (D). |
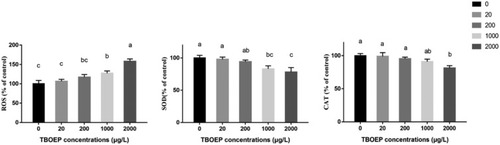
Fig. 5. Oxidative stress assay was performed at 120 hpf. (A) Content of ROS. (B) Activity level of SOD. (C) Activity level of CAT. Values are presented as the mean ± SEM of 3 replicates (20 larvae/replicate, 60 larvae/replicate and 60 larvae/replicate, respectively). Significant differences among groups were indicated by different letters over the bars. |

Fig. 6. Body length of zebrafish epibolies/larvae at 12, 72 and 120 hpf (A) and gene expression in zebrafish embryos/larvae (B) at 12 (i), 24 (ii), 72 (iii) and 120 hpf (iv) after exposure to various solution (control, 2000 μg/L TBOEP, BIO and 2000 μg/L TBOEP + BIO). Values are presented as the mean ± SEM of 3 replicates (10 larvae/replicate) (A) and (20 larvae/replicate) (B). Significant differences among groups were indicated by different letters over the bars. |

Fig. 7. Schematic representation of the possible mechanisms underlying TBOEP-induced developmental toxicity. |