
- Title
-
Tbx20 Induction Promotes Zebrafish Heart Regeneration by Inducing Cardiomyocyte Dedifferentiation and Endocardial Expansion
- Authors
- Fang, Y., Lai, K.S., She, P., Sun, J., Tao, W., Zhong, T.P.
- Source
- Full text @ Front Cell Dev Biol
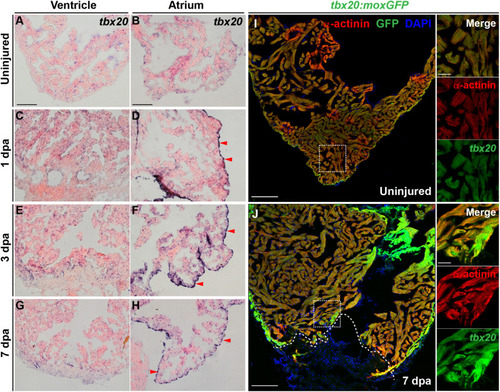
Cardiac injury triggers a localized increase in |

Myocardial |

|

Myocardial |
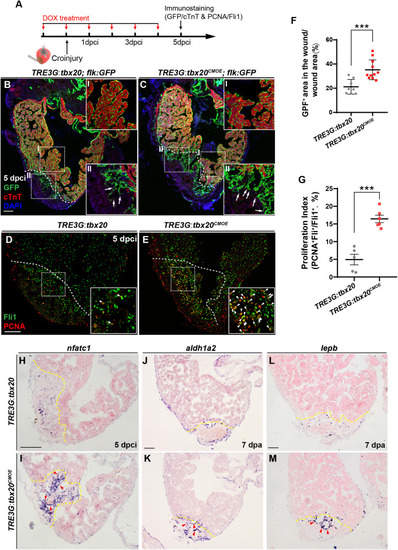
Myocardial |
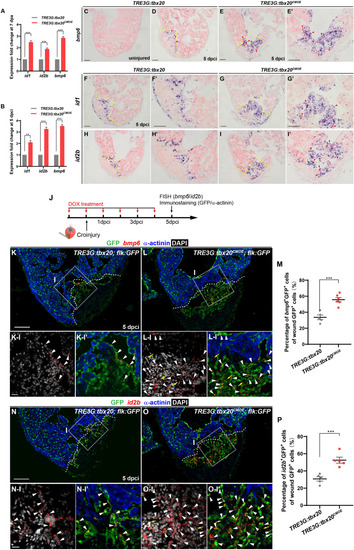
Myocardial Tbx20 mediates endocardial regeneration by activating Bmp6 signaling. |
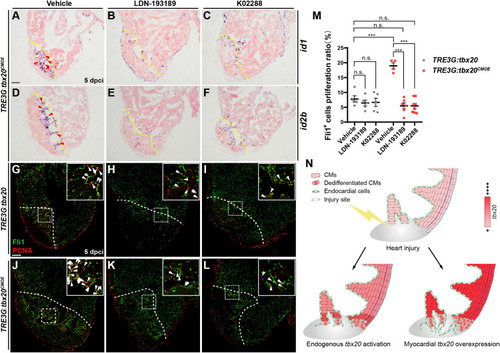
Inhibition of Bmp6 signaling restricts endocardial cell proliferation activated by myocardial |