IMAGE

FIGURE 7

ID
ZDB-IMAGE-200829-79
Source
Figures for Fang et al., 2020
Image
Figure Caption

FIGURE 7

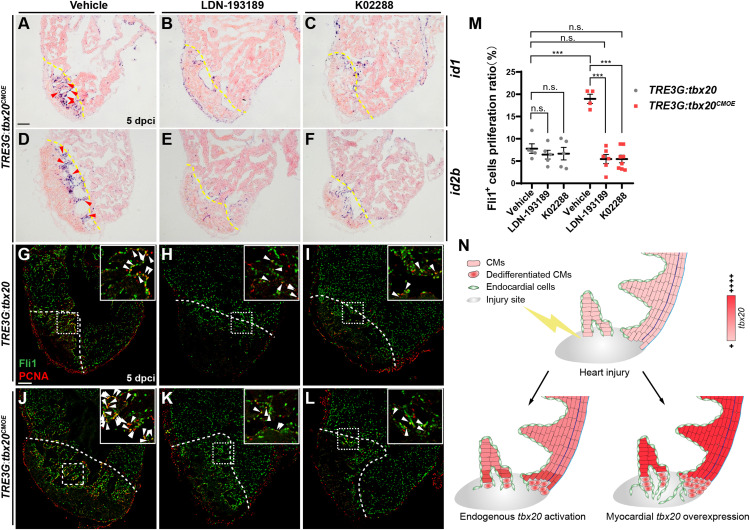
Inhibition of Bmp6 signaling restricts endocardial cell proliferation activated by myocardial tbx20 overexpression. (A–F) Representative ISH images showing expression of id1(A–C) and id2b(D–F) in DOX treated Tg(TRE3G:tbx20CMOE) fish at 5 dpci after vehicles or inhibitors treatment. Red arrowheads indicate endocardium with id1(A) and id2b(D) signal in the injury site. (G–L) Representative confocal fluorescence images of heart sections immunostained for Fli1 (green) and PCNA (red) from vehicle, LDN-193189 and K02288 treated control (G–I) and myocardial tbx20 overexpressing fish (J–L) at 5 dpci. Boxed areas indicate locations of the magnified insets. Arrowheads point to the Fli1+PCNA+ proliferating endocardial cells. (M) Scatter plot showing the percentage of Fli1+ cell proliferation ratio in the border zone and injury site from (G–L). The values are mean ± S.E.M. Two-way ANOVA followed with Tukey’s multiple comparison test. n.s.: none significance, ***p < 0.001. (N) Model of myocardial tbx20 function during zebrafish heart regeneration: In CMs, myocardial tbx20 overexpression promotes CM dedifferentiation and proliferation following injury. In addition, myocardial tbx20 promotes endocardial regenerative progress by enhancing its proliferation via partially through Bmp6 signaling. Dashed lines delineate the injured area. Scale bar: 100 μm.

Acknowledgments
This image is the copyrighted work of the attributed author or publisher, and ZFIN has permission only to display this image to its users. Additional permissions should be obtained from the applicable author or publisher of the image. Full text @ Front Cell Dev Biol