FIGURE SUMMARY
Title

Redundant Trojan horse and endothelial-circulatory mechanisms for host-mediated spread of Candida albicans yeast

Authors
Scherer, A.K., Blair, B.A., Park, J., Seman, B.G., Kelley, J.B., Wheeler, R.T.
Source
Full text @ PLoS Pathog.

Macrophage and neutrophil recruitment to the site of infection is positively associated with dissemination and proinflammatory cytokine upregulation.

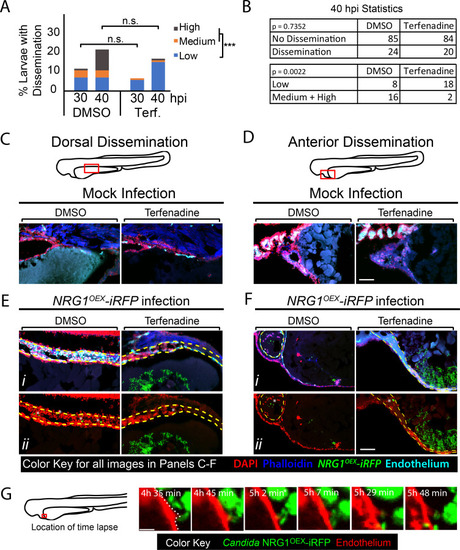
Larvae were infected with far-red fluorescent yeast-locked C. albicans NRG1OEX-iRFP in the yolk sac at ~32 hours post fertilization (hpf). (A) Schematic of the yolk sac injection and timeline of the infection and screening for both recruitment of phagocytes and dissemination of yeast. (B) Progression of infection where larvae with early recruitment of macrophages go on to develop disseminated infection and larvae rarely revert back to a non-disseminated state. Top circles represent the percentages of fish, by infection category, at 24 hpi, colored by recruitment/dissemination phenotype. Bottom bars represent subsequent phenotypes at 40 hpi, grouped based on their 24 hpi phenotype. Scores were pooled from larvae with fluorescent macrophages from a total of 12 experiments: 5 experiments in Tg(mpeg:GAL4)/(UAS:Kaede), 4 experiments in Tg(mpeg:GAL4)/(UAS:nfsb-mCherry), and 3 experiments in Tg(fli1:EGFP) x Tg(mpeg:GAL4)/(UAS:nfsb-mCherry). A total of 197 fish were followed from 24 to 40 hpi. (C) Examples of each infection category in Tg(mpeg:GAL4)/(UAS:nfsb-mCherry)/Tg(mpx:EGFP) larvae. The yolk sac is outlined in a dotted magenta line and the approximate proportion of larvae with this score at 40 hpi is indicated in the lower right of the image (the remainder of fish died between 24 and 40 hpi). Arrows indicate disseminated yeast in the representative image of a fish with dissemination, which is also enlarged below for clearer viewing. Scale bar = 150 μm. (D) Tg(mpeg:GAL4)/(UAS:nfsb-mCherry) larvae were scored for macrophage recruitment to the site of infection and yeast dissemination at 24 hpi, then groups of 6–10 were homogenized for qPCR. Gene expression for TNFα, IL1β, and IL-6 were measured and mock-infected larvae were used for reference. Data come from 3 independent experiments with 97 PBS larvae, 50 No recruitment/No dissemination, 32 Recruited/No dissemination, and 18 Recruited/Disseminated total larvae used for analysis. Means are shown with standard error of measurement. One-way ANOVA with Dunnett’s multiple-comparisons post-test demonstrates significantly higher gene expression in larvae with recruited macrophages at the site of infection, regardless of dissemination scores (* p≤ 0.05, ** p ≤ 0.01, *** p ≤ 0.001, **** p < 0.0001). (E-F) Representative Tg(lysC:Ds-Red)/Tg(tnfa:GFP) larvae with red fluorescent neutrophils and green fluorescence with tnfα expression in either a mock infected larvae (E) or a yeast-locked C. albicans infected fish (F). Neutrophils are recruited to the yolk sac and tnfα is expressed at the site of infection and in the tail with disseminated yeast cells (indicated with blue arrows). Scale bar = 100 μm.

Phagocytes actively participate in the transport of yeast within the bloodstream.

Tg(mpeg1:GAL4/UAS:nfsb-mCherry)/Tg(mpx:EGFP) or Tg(mpeg1:GAL4)x(UAS:Kaede) larvae were infected with yeast-locked C. albicans and scored for recruitment of macrophages and dissemination of yeast at 24 hpi. (A) Neutrophils and macrophages were observed moving within and away from the infection site carrying yeast. Time-lapse taken over the course of 7 hours starting at ~32 hpi. The schematic above illustrates the area imaged. The top multicolor image shows the relative distributions of macrophages (red), neutrophils (green) and fungi (blue) and indicates the edge of the yolk with a white dotted line. In lower panels, dots and lines indicate tracks taken by phagocytes during the time lapse, with magenta arrowheads indicating the direction of movement. Phagocytes were observed taking yeast from the site of infection in these cases. The bottom panel illustrates all tracked paths from the time lapse in a single overlay image. Scale bar = 50 μm. Frames taken from S1 Movie. (B) A schematic of our macrophage photo-conversion experiments where Tg(mpeg1GAL4) x Tg(UAS:Kaede) macrophages near the infection site were photoswitched at 24 hpi, and confocal images of each photoswitched larva were taken at 24, 30, and 40 hpi to track macrophages. Macrophages near the site of infection but not interacting with yeast were identified as “bystander” macrophages. (C) Time-lapse panels of Tg(mpeg1GAL4) x Tg(UAS:Kaede) larva with a photoconverted macrophage moving out of the blood stream into tail tissue. The top schematic shows the regions used for photoswitching (magenta dashed box) at 24 hpi and the region selected for time-lapse (magenta solid box) from ~46 hpi to ~53 hpi. The yellow highlighted area demonstrates a photo-converted macrophage stopping in the bloodstream, rolling down the tail, and then releasing yeast. White arrowhead in the image panel highlights an apparent non-lytic expulsion (NLE) event. Time stamps indicate HR:MIN. Frames taken from S3 Movie. Scalebar = 100 μm. (D) (Top) Area of tail imaged by time-lapse microscopy in an independent fish from that shown in (C). White arrowheads indicate macrophages followed in detail below. (Below) Middle column of frames highlights yeast growth within a photo-converted macrophage and left and right columns of frames show apparent NLE release of yeast cells from macrophages. Time stamps indicate HR:MIN. White arrowheads within images indicate apparent NLE events. Frames are taken from S4 Movie. Scalebar = 10 μm.

Phagocytes are not required for yeast dissemination to occur.

Rac2-D57N and AB sibling larvae were injected with control or clodronate liposomes mixed with a 10 kDa dextran conjugated with Cascade Blue in the caudal vein at 28 hpf. Larvae were infected with the yeast locked C. albicans 4 hours later as described above. (A) Percent infected larvae with dissemination scored as “low” (1–10), “medium” (10–50), and “high” (>50 yeast) disseminated yeast at 40 hpi. Pooled from 6 experiments. Stats: Fisher’s Exact test, n.s. not significant p>0.05 (B) Total pixel counts for quantified disseminated yeast for each group are shown with the median and interquartile range. Same larvae as in Panels C & D. (C) Method used to quantify disseminated yeast. Yeast were scored as Intracellular (I; inside or in close contact with a phagocyte) or Extracellular (E; not contained or in contact with phagocytes). Images were processed in ImageJ. Scale bar = 50 μm. (D) The proportion of all yeast either Intracellular or Extracellular for each treatment group. Stats: Kruskall-Wallis with Dunn’s posttest (* p≤ 0.05, ** p ≤ 0.01, *** p ≤ 0.001, **** p < 0.0001), and bars indicate the median with interquartile range. Pooled from 6 experiments. Stats: Kruskall-Wallis with Dunn’s post-test. All comparisons were n.s.

Macrophages are primarily responsible for TNFα production.

Tg(lysC:Ds-Red)/Tg(tnfα:GFP) or Rac2-D57N/ Tg(tnfα:GFP) larvae with red fluorescent neutrophils and green fluorescence with tnfα expression were infected with a yeast-locked C. albicans as described. (A) Representative images of control and clodronate treated Tg(LysC:Ds-Red)/Tg(tnfα:GFP) larvae with functional neutrophils infected with a yeast-locked C. albicans at 40 hpi. Area in yellow outlines area of Candida growth in the yolk sac. Images were used to quantify neutrophil recruitment and tnfα expression. Scale bar = 100 μm. Markings are clarified in box below images. (B) and (C) Images were analyzed with ImageJ. (B) Neutrophil recruitment to the area of infection is not affected by macrophage ablation. Data pooled from 5 experiments, total fish used for quantification, left to right: n = 10, 21, 9, 23. Bars are the median with 95% confidence interval. Stats: Kruskall-Wallis with Dunn’s post-test. * p ≤ 0.05. (C) Larvae with ablated macrophages have an almost complete loss of tnfα expression. Bars are the means and SEM for ease of viewing. Stats: Mann-Whitney. * p ≤ 0.05, **p ≤ 0.01. (D) and (E) Representative images of control (left) and clodronate (right) treated Rac2-D57N x Tg(tnfα:GFP) sibling larvae infected with a yeast-locked C. albicans at 40 hpi. Area in magenta shows the yolk sac outline. Scale bar = 50 μm. (F) Larvae in which macrophages are ablated also have an almost complete loss of tnfα expression, which is independent of neutrophils. Pooled from 5 experiments. Stats: Kruskall-Wallis with Dunn’s post-test, * p ≤ 0.05, ** p ≤ 0.01, and bars are the mean and SEM.

Blockade of blood flow partially limits dissemination.

(A-G) Tg(fli1:EGFP) larvae, with GFP-expressing endothelial cells, were infected as previously described, treated with vehicle (DMSO) or terfenadine (2 μM) and processed for histology at 40 hpi. (A-B) Percent larvae with dissemination at 30 and 40 hpi scored as having “low” (1–10), “medium” (10–50), and “high” (>50 yeast) disseminated yeast. Pooled from 7 experiments, DMSO n = 110, Terfenadine n = 118. Fisher’s Exact test was used to test for differences between “low” and “medium” plus “high” scores at 40 hpi, *** p ≤ 0.001. (C-F) Sections of Tg(fli1:EGFP) mock infected (C-D) and Candida-infected (E-F) larvae compare dorsal dissemination (E) and anterior dissemination (F) events to the same tissue in mock-infected fish. Sections were stained with DAPI (nuclei, red) to indicate surrounding cells and phalloidin (actin; blue) to indicate host structures. NRG1OEX-iRFP (green) and Tg(fli1:EGFP) (cyan) retained fluorescence during sectioning and staining. White asterisks indicate disseminated yeast which appear to be embedded in the yolk syncytial layer and larval heart. Scale bar = 100 μm. (G) A vehicle-treated Tg(fli1:EGFP) (red) fish infected with NRG1OEX-iRFP (green) with intact blood flow was imaged by time-lapse. Area in red box is the focus of the time-lapse, with frames taken from S14 Movie a cropped area of the complete time lapse included as S15 Movie. Scalebar = 10 μm.

Dissemination is inhibited with loss of phagocytes and blood flow.

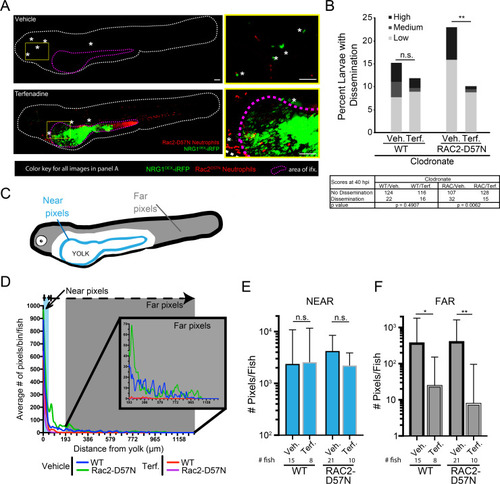
Rac2-D57N zebrafish were crossed with AB fish for neutrophil-deficient or wild type offspring. All larvae were injected with clodronate liposomes for macrophage ablation and bathed in vehicle (DMSO) or 2 μM terfenadine for blood flow blockade. Larvae were then infected with NRG1OEX-iRFP. (A) Representative Rac2-D57N larvae with dissemination either with (Vehicle) or without (Terfenadine) blood flow. The white line outlines the fish body, the magenta line indicates the yolk sac, and white asterisks denote yeast that are disseminated. The yellow box indicates an area with disseminated yeast that has been magnified at the right. Scale bar = 100 μm. (B) Percent larvae with scores of dissemination at 40 hpi, pooled from 6 experiments. Stats: Fisher’s exact test, * p ≤ 0.05. (C) Schematic of the scoring system for disseminated yeast. Yeast that were ≤25 pixels from the yolk sac edge were scored as “near” and yeast that were ≥55 pixels from the yolk sac edge were scored as “far”. (D) A frequency distribution histogram of the distance in pixels that yeast travel from the yolk sac edge sorted into single bins. Distances less than 5 pixels was omitted from analysis. Same fish quantified as in C and D. Pooled data from 54 larvae. (E) Total number of near yeast pixels per fish, shown as median and confidence interval (F) Total number of far yeast pixels per fish, shown as median and confidence interval. (D-F) Pooled from 6 experiments. Stats: Mann-Whitney, n.s. not significant, * p ≤ 0.05, ** p ≤ 0.01.

Wild type <italic>C</italic>. <italic>albicans</italic> mirrors yeast-locked strain.

Tg(Mpeg:GAL4)/(UAS:nfsB-mCherry)/Tg(mpx:EGFP) or RAC2-D57N/Tg(tnfα:GFP) larvae were injected with control or clodronate liposomes and infected with the wild type Caf2-iRFP C. albicans as described for the yeast-locked infections. (A) Dissemination dynamics for wildtype fungi are similar to dynamics for yeast-locked and are unaffected by macrophage ablation. Tg(Mpeg:GAL4)/(UAS:nfsB-mCherry)/Tg(mpx:EGFP) were infected and scored for immune recruitment and dissemination of yeast between 24 and 40 hpi, as described in Fig 1B. Top circles represent the percentages of fish at 24 hpi, colored with the indicated recruitment/dissemination phenotype. Bottom bars represent phenotypes at 40 hpi, grouped based on their 24 hpi phenotype. Pooled from 2 experiments, control larvae n = 16, clodronate larvae n = 21. (B) Representative images of Recruited/Non-disseminated Tg(Mpeg:GAL4)/(UAS:nfsB-mCherry)/Tg(mpx:EGFP) larvae treated with control or clodronate liposomes at 40 hpi. Area in yellow shows the yolk sac outline. Scale bar = 50 μm. (C) Dissemination of wildtype yeast does not require intact phagocytes. Percent dissemination of Tg(Mpeg:GAL4)/(UAS:nfsB-mCherry)/Tg(mpx:EGFP) larvae (left) and RAC2-D57N/Tg(tnfα:GFP) larvae (right) at 40 hpi. Right: Pooled from 2 experiments as in panel A. Left: Pooled from 3 experiments. Fisher’s exact test, n.s. (D) Wildtype elicits a macrophage-dependent expression of TNFα. Representative images of control (left) and clodronate (right) treated Rac2-D57N/Tg(tnfα:GFP) larvae. Yellow outlines the yolk sac. Scale bar = 100 μm. (E) Pixel area of host cells expressing tnfα during wild type C. albicans infection. Pooled from 3 experiments. (F) Fungal burden quantified as fluorescent pixels in z-stack images (for each time-point, from left to right n = 8, 3, 8, 7, 10, 6, 10 and 6 larvae). Stats: Kruskal-Wallis with Dunn’s post-test, * p ≤ 0.05, ** p ≤ 0.01, *** p ≤ 0.001., **** p ≤ 0.0001, n.s. p > 0.05. Bars indicate the mean and SEM.

Acknowledgments
This image is the copyrighted work of the attributed author or publisher, and ZFIN has permission only to display this image to its users. Additional permissions should be obtained from the applicable author or publisher of the image. Full text @ PLoS Pathog.