
- Title
-
Nanobody-directed targeting of optogenetic tools to study signaling in the primary cilium
- Authors
- Hansen, J.N., Kaiser, F., Klausen, C., Stüven, B., Chong, R., Bönigk, W., Mick, D.U., Möglich, A., Jurisch-Yaksi, N., Schmidt, F.I., Wachten, D.
- Source
- Full text @ Elife
( |
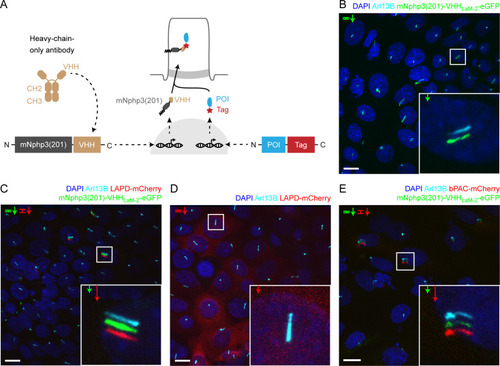
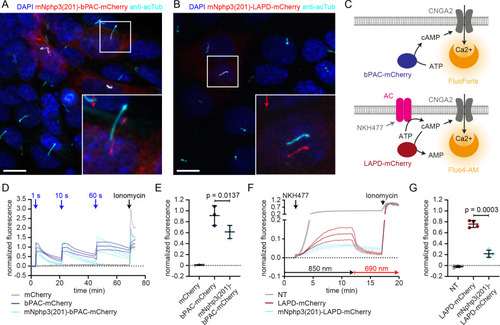
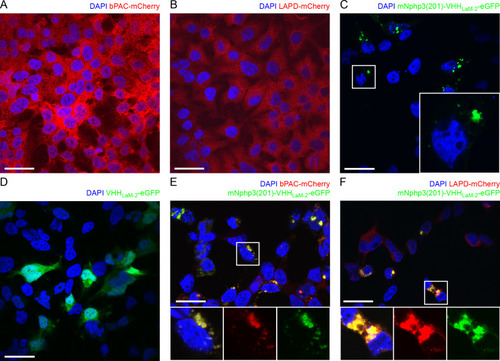
(A) Schematic overview of the targeting approach. Nanobodies were fused to the C terminus of mNphp3(201) for ciliary localization. The protein of interest (POI) is co-expressed with a C-terminal tag or fusion partner that is recognized by the nanobody. Binding of the nanobody to the tag is expected to result in ciliary localization of the POI. (B) Localization of the anti-mCherry nanobody (VHHLaM-2) to primary cilia. mIMCD-3 cells were transfected with mNphp3(201)-VHHLaM-2-eGFP (green). (C) Localization of the anti-mCherry nanobody and LAPD-mCherry to primary cilia. mIMCD-3 cells were co-transfected with mNphp3(201)-VHHLaM-2-eGFP (green) and LAPD-mCherry (red). (D) Cytoplasmic localization of LAPD-mCherry. mIMCD-3 cells were transfected with LAPD-mCherry (red). (E) Localization of the anti-mCherry nanobody and bPAC-mCherry to primary cilia. mIMCD-3 cells were co-transfected with mNphp3(201)-VHHLaM-2-eGFP (green) and bPAC-mCherry (red). All cells shown in B-E were labeled with an Arl13B antibody (cyan, ciliary marker) and DAPI (blue). All scale bars: 10 μm. Boxes indicate the position of the magnified view shown at the bottom right. Arrows in different colors indicate the direction and the length of the shift of the respective fluorescence channel. |
( |
( |
( |
( |
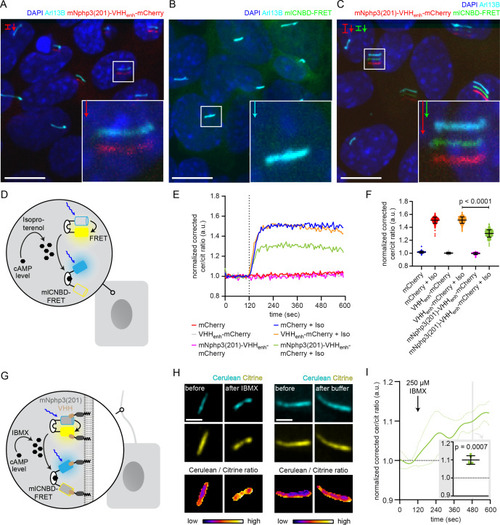
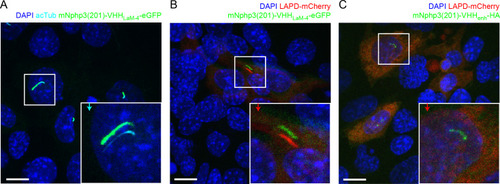
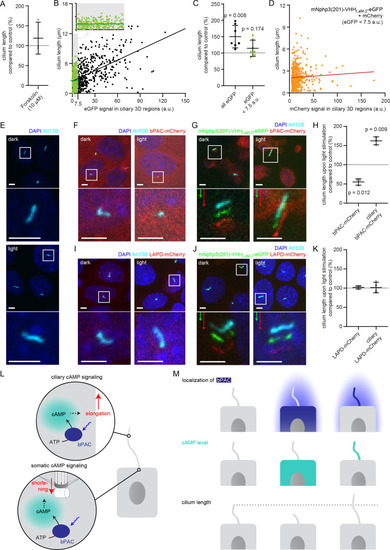
(A) Localization of the mNphp3(201)-VHHenhancer-mCherry anti-eGFP nanobody to primary cilia. (B./C) Localization of mlCNBD-FRET in mIMCD-3 cells in the (B) absence or (C) presence of mNPHP3(201)-VHHenhancer-mCherry. (D) Schematic overview of mlCNBD-FRET imaging in non-ciliated HEK293 cells (see E-F). (E) FRET imaging in HEK293 mlCNBD-FRET cells transiently co-expressing mCherry, VHHenhancer-mCherry, or mNphp3(201)-VHHenhancer-mCherry under control conditions or after stimulation with 20 μM isoproterenol (Iso, addition depicted with dotted line). Data are shown as mean (n = 3 independent experiments, 30–90 cells per experiment). (F) Comparison of maximal change for data shown in E. Data are presented as individual data points and mean ± S.D.; p-value calculated using an unpaired, two-tailed Mann-Whitney test is indicated. (G) Schematic overview of mlCNBD-FRET imaging in the primary cilium of mIMCD-3 cells (see H-I). (H) FRET imaging in primary cilia of mIMCD-3 cells expressing mlCNBD-FRET and mNphp3(201)-VHHenhancer-mCherry. Cells have been stimulated with 250 μm IBMX (left) or buffer only (right). Cerulean and citrine are shown before and after stimulation with IMBX. The change in cerulean/citrine ratio is shown below (color-scheme indicated at the bottom). Scale bar: 2 μm. (I) Time course of mean change in FRET (dark green line)± S.D. (dotted green line) for data set, exemplary shown in H; n = 5. Inset: each data point shows the time-average per cilium at the position indicated by grey box; one-sample Student’s t-test compared to 1.0 indicated. |
( |
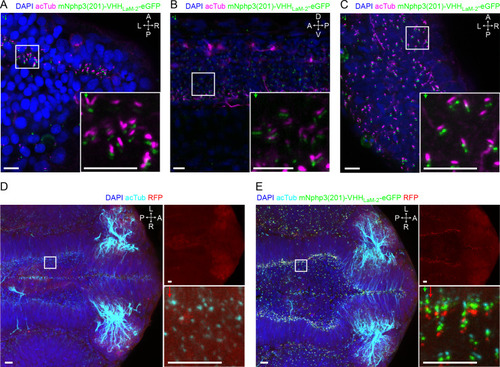
(A) Nanobody localization in the neural tube of a zebrafish embryo. The mRNA of the anti-mCherry mNphp3(201)-VHHLaM-2-eGFP nanobody was injected into nacre zebrafish embryos. Embryos were stained with an anti-acetylated tubulin antibody (magenta, ciliary marker), an anti-GFP antibody (green), and DAPI (blue). (B) See A. for spinal cord. (C) See A. for eye. (D) RFP (red) expression in the neural tube of Ubi:zebrabow (Pan et al., 2013) transgenic embryos. (E) RFP (red) expression in the neural tube of Ubi:zebrabow (Pan et al., 2013) transgenic embryos, injected with mRNA of the anti-mCherry mNphp3(201)-VHHLaM-2-eGFP nanobody. Scale bars: 20 μm, magnified view: 10 μm. Boxes indicate the position of the magnified views shown at the bottom right as inset (A-C) or as a separate panel next to the overview image (D, E). Arrows in different colors indicate the direction and the length of the shift of the respective fluorescence channel. The upper right panel in D and E shows the RFP channel only, the bottom right panel shows the magnified view. A: anterior, P: posterior, L: left, R: right, D: dorsal, V: ventral. All images were taken from fixed samples. |
( |
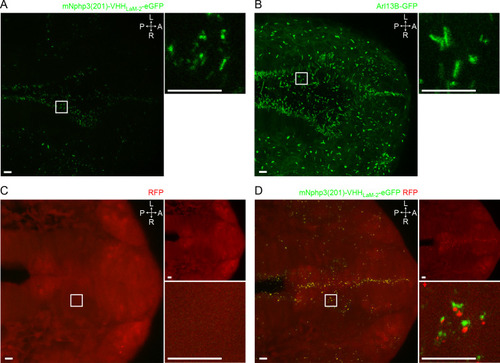
(A) Cilia length of mIMCD-3 cells stimulated for 1 hr with 10 μM Forskolin (solvent: DMSO), normalized to the DMSO control. Data are shown as mean ± S.D., n = 3 with at least 40 cells per experiment. (B) Correlation of cilia length and eGFP fluorescence (a.u., average ciliary fluorescence of non-transfected control cells was subtracted) in the cilium in mIMCD-3 cells transiently expressing mNphp3(201)-VHHLaM-2-eGFP. Below 7.5 a.u., the cilia length is independent of the eGFP fluorescence (see inset, values are highlighted in green, slope not different from zero, correlation: p=0.07), whereas including values > 7.5 a.u., there is a linear correlation between the cilia length and the eGFP fluorescence in the cilium (slope different from zero, correlation: p<0.0001). (C) Length of cilia that show mNphp3(201)-VHHLaM-2-eGFP localization and an eGFP fluorescence < 7.5 a.u., normalized to equally treated, non-transfected (NT) control cells. Data are shown as mean ± S.D., n = 7 with at least 18 cilia per experiment; p-values determined using unpaired, two-tailed Student’s t-test are indicated. (D) Correlation of cilia length and mCherry fluorescence in the cilium in mIMCD-3 cells transiently expressing mNphp3(201)-VHHLaM-2-eGFP and mCherry. Only cilia with an eGFP fluorescence below 7.5 a.u. were taken into account. There is no linear correlation between the mCherry fluorescence and cilia length (slope not different from zero, correlation: p=0.2). (E) mIMCD-3 cells (non-transfected, NT) kept in the dark (top) or stimulated with light (bottom, 1 hr, 465 nm, 38.8 µW/cm²) (F) mIMCD-3 bPAC-mCherry cells kept in the dark (left) or stimulated with light (right, 16 hr, 465 nm, 38.8 µW/cm²). (G) mIMCD-3 bPAC-mCherry transiently transfected with mNphp3(201)-VHHLaM-2-eGFP kept in the dark (left) or stimulated with light (right, 1 hr, 465 nm, 38.8 µW/cm²). (H) Normalized cilia length after light stimulation (left 1 hr, right 16 hr; 465 nm, 38.8 µW/cm²) for mIMCD-3 bPAC-mCherry cells with or without transiently expressing mNphp3(201)-VHHLaM-2-eGFP. Only cilia with an eGFP fluorescence < 7.5 a.u. were included and each data point was normalized to control cells. Data are shown as mean ± S.D., n = 3 with at least 25 cells per experiment; p-values determined using one-sample Student’s t-test compared to 100% are indicated. (I) mIMCD-3 LAPD-mCherry cells kept in the dark (left) or stimulated with light (right, 16 hr, 630 nm, 42.3 µW/cm²). (J) mIMCD-3 LAPD-mCherry transiently transfected with mNphp3(201)-VHHLaM-2-eGFP kept in the dark (left) or stimulated with light (right, 16 hr, 630 nm, 42.3 µW/cm²). (K) Normalized cilia length after light stimulation (16 hr, 630 nm, 42.3 µW/cm²) for mIMCD-3 LAPD-mCherry with or without transiently expressing mNphp3(201)-VHHLaM-2-eGFP. Only cilia with an eGFP fluorescence < 7.5 a.u. were included and each data point was normalized to control cells. Data are shown as mean ± S.D., n = 3–4 with at least 18 cells per experiment; p-values determined using one-sample Student’s t-test compared to 100% are indicated. Cells in E-G and I-J were stained with an Arl13B antibody (cyan) and DAPI (blue). All boxes indicate the magnified view below. Arrows indicate the direction and the length of the shift of the respective same-colored fluorescence channel. Scale bar for all images: 3 μm. (L) Spatial cAMP signaling controlling cilia length. Our data suggest a model, in which cAMP signaling in the cell body, stimulated by photoactivation of bPAC and an increase in cAMP levels, causes primary cilia shortening, whereas an increase of cAMP levels in the cilium results in primary cilia elongation. (M) Summary of the correlation between bPAC localization and photoactivation, cAMP levels, and cilia length. |
( |