FIGURE SUMMARY
Title

Interleukin-6 signaling regulates hematopoietic stem cell emergence

Authors
Tie, R., Li, H., Cai, S., Liang, Z., Shan, W., Wang, B., Tan, Y., Zheng, W., Huang, H.
Source
Full text @ Exp. Mol. Med.

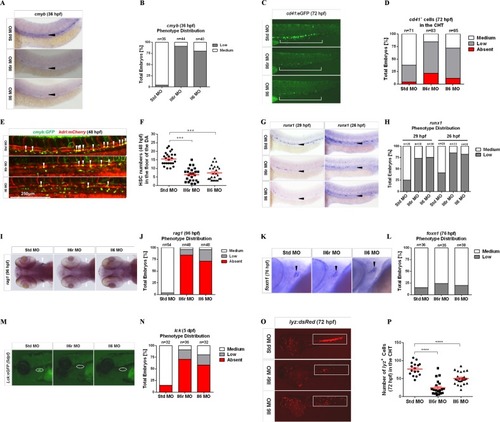
Il6r and Il6 are required for HSC generation.

a Standard control (Std), Il6r, and Il6 morphants were detected by WISH for cmyb expression in the dorsal aorta (DA) at 36 hpf. Black arrowheads denote cmyb+ HSCs. b Qualitative phenotype distribution of the embryos (n above the bar graph denotes the number of embryos per group) from a scored with medium (normal) and low (down) cmyb expression. Medium, white bar; low, gray bar. ccd41:eGFP transgenic embryos were injected with Std, Il6r, and Il6 MOs and visualized at 72 hpf in caudal hematopoietic tissue (CHT). The white long line denotes cd41+ cells in the CHT region. d Qualitative phenotype distribution of embryos from c scored as in b. Medium, white bar; low, gray bar; absent, red bar. e Confocal tracking of HSC numbers in the floor of the DA region from individual cmyb:GFP; kdrl:mCherry double-transgenic embryos at 48 hpf. White arrowheads denote cmyb+, kdrl+ HSCs, scale bar represent 250 μm. f Enumeration of cmyb+, kdrl+ HSCs from e, bars represent the means ± SEM of Std (n = 24), Il6r (n = 24), and Il6 (n = 24) morphants. ***P < 0.001. g Std, Il6r, and Il6 morphants were examined by WISH for runx1 expression at 29 and 26 hpf, respectively. Black arrowheads represent HSCs in the floor of the DA region. h Qualitative phenotype distribution of embryos from g scored as in d. i, k Representative WISH images for rag1+ T lymphocyte (i) (white arrowheads) and foxn1+ thymic epithelial markers (black arrowheads) at 96 and 76 hpf, respectively. j, l Qualitative phenotype distribution of embryos from i, k scored as in d. m Representative images of lck+ T lymphocytes in Il6r and Il6 morphants compared to Std controls at 5 dpf. White dashed lines denote the thymus. n Qualitative phenotype distribution of embryos from m scored as in d. o Representative images of lyz:dsRed transgenic embryos injected with Std, Il6r, and Il6 MOs. White blocks denote the CHT and trunk regions. p Enumeration of lyz+ myeloid cells shown in o. Bars represent the means ± SEM of Std (n = 16), Il6r (n = 21), and Il6 (n = 24) morphants. ****P < 0.0001

Il6 signaling is required for HSC-independent neutrophil development, but is not indispensable for the development of HSC-independent macrophages and primitive erythrocytes.

a Representative images of Std, Il6r, and Il6 morphants detected by WISH for mpx and l-plastin expression at 28 hpf. The white block denotes the posterior blood island (PBI) region, and the black block denotes the PBI and trunk regions. b Qualitative phenotype distribution of embryos from a scored with medium (normal) and low (down) mpx and l-plastin expression, respectively. Medium, white bar; low, gray bar. c Confocal tracking of HSC-independent macrophages in mpeg1:GFP transgenic embryos injected with Std, Il6r, and Il6 MOs at 32–36 hpf. d Enumeration of mpeg1+ macrophages cells in the yolk sac, PBI, and trunk regions from c. Bars represent the means ± SEM of Std (n = 12), Il6r (n = 12), and Il6 (n = 12) morphants. n.s., Not significant. e Representative images of Std, Il6r, and Il6 morphants interrogated by WISH for gata1a expression at 24 hpf. f Qualitative phenotype distribution of embryos from e scored as in b

Signaling through Il6r regulates HSC development under the normal vasculogenesis.

a Std, Il6r, and Il6 morphants were interrogated by WISH for kdrl, efnb2a, and dlc at 28 hpf. Black arrowheads denote the vascular lines. b Qualitative phenotype distribution of embryos from a scored with medium, high (up), and low (down) expression of these markers. Medium, white bar; high, red bar; low, gray bar. c Maximum projections of the DA region of fli1a:eGFP embryos at 30 hpf injected with Std, Il6r, and Il6 MOs and assayed for immunohistochemistry for GFP (green) and TUNEL (red). Scale bar represents 200 μm. d Embryos from the same experiment as in c were subjected to WISH for runx1 expression at 30 hpf. Black arrowheads denote HSCs in the floor of the DA region. e Qualitative phenotype distribution of embryos from d scored as in b

Il6r acts downstream of Notch signaling in HSC development.

a Confocal tracking of HSC numbers from individual tp1:eGFP; kdrl:mCherry double-transgenic embryos injected with Std, Il6r, and Il6 MOs at 32–36 hpf. White arrowheads denote tp1+, kdrl+ HSCs with active Notch signaling in the floor of the DA region. b Enumeration of HSCs from a, bars represent the means ± SEM of Std (n = 10), Il6r (n = 8), and Il6 (n = 8) morphants. n.s., Not significant. c WISH for cmyb in the DA region of DMSO-treated, DAPT-treated, DAPT-treated plus il6r mRNA-injected embryos at 48 hpf. Black arrowheads denote HSCs in the floor of the DA region. d Qualitative phenotype distribution of embryos from c scored with medium, high, and low cmyb expression. Medium, white bar; high, red bar; low, gray bar. e Representative images of cd41:eGFP transgenic embryos treated with DMSO, DAPT, and DAPT plus il6r mRNA. Hematopoietic cells in the CHT region were visualized at 72 hpf. The white long line denotes the CHT region. f Qualitative phenotype distribution of the embryos from e scored as in d. g The expression of genes including il6r, gp130, hey1, myod, and gata2b relative to ef1a from purified fli1a+ endothelial cells in 28 hpf Std and Notch1a morphants. Bars represent the means ± SEM of duplicate samples. **P < 0.01; ***p < 0.001; n.s., not significant. h WISH for runx1 expression in the DA region in Std-, Tnfα-deficient embryos and Tnfα MO + il6r mRNA embryos at 28 hpf. i Qualitative phenotype distribution of embryos from h scored as in d

HSC-independent neutrophils play a key role in HSC specification.

a, b qPCR for detecting the expression of genes, including pu.1, csf1ra, mpx, il6r, il6, and gp130, from purified HSC-independent macrophages (mpeg1:GFP+) and neutrophils (mpx:GFP+) at 30 hpf. Expression was normalized to ef1a and is presented relative to whole-embryo expression. Bars represent the means ± SEM of duplicate samples. *P < 0.05; **p < 0.01; ***p < 0.001; n.s., not significant. c Std and Pu.1 morphants were examined by WISH for runx1 expression at 28 hpf. d Qualitative phenotype distribution of embryos from c scored with medium, high, and low runx1 expression. Medium, white bar; high, red bar; low, gray bar. e Std, Irf8, and Il6 + Irf8 morphants were examined by WISH for runx1 and mpx at 29 hpf. Black arrowheads denote runx1+ HSCs in the DA region and mpx+ neutrophils in the PBI and trunk regions. f Qualitative phenotype distribution of embryos from e scored as in d. g Whole-embryo expression of il6 and gata2b relative to ef1a in Std, Pu.1, and Irf8 morphants at 28 hpf. Bars represent the means ± SEM of duplicate samples. **P < 0.01; ***p < 0.001

Acknowledgments
This image is the copyrighted work of the attributed author or publisher, and ZFIN has permission only to display this image to its users. Additional permissions should be obtained from the applicable author or publisher of the image. Full text @ Exp. Mol. Med.