
- Title
-
A Neural Representation of Naturalistic Motion-Guided Behavior in the Zebrafish Brain
- Authors
- Yildizoglu, T., Riegler, C., Fitzgerald, J.E., Portugues, R.
- Source
- Full text @ Curr. Biol.
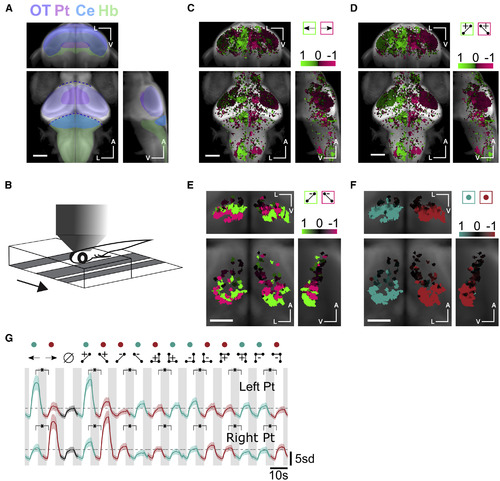
Neuronal Responses in the Pretectum Are Anatomically Lateralized and Direction Selective for Glider Stimuli (A) Whole-brain anatomical map from a reference brain (constructed from a confocal stack of Tg(elavl3:GCaMP6f) 7 dpf larva), on which all subsequent ROI selectivity maps were overlaid. Brain structures referred to in the text are highlighted (approximate locations). OT, Optic Tectum; Pt, Pretectum; Ce, Cerebellum; Hb, Hindbrain. (B) Schematic of two-photon imaging setup in which the larva was head-embedded in agarose but free to move its tail. We presented visual motion stimuli from below, and the behavior could be tracked while imaging the neural activity. (C) Whole-brain direction selectivity map moving sine gratings, revealing left preferring (green) and right preferring (magenta) regions (30,778 ROIs from 11 fish). (D) Whole-brain direction selectivity maps for two-point glider stimuli. (E) Pretectum direction selectivity maps for negative two-point glider stimuli. Direction selectivity in the ventral (dorsal) pretectum was opposite (matched) to the orientation of positive two-point glider stimuli (559 ROIs from 11 fish). (F) Pretectum direction selectivity maps comparing all stimuli driving leftward turning (green) to those driving rightward turning (red). Direction selectivity in the pretectum was lateralized in a manner that matched the direction of the turning behavior. For each set of maps, we show coronal (center of triplet), transverse (top of triplet), and right sagittal projections (right of triplet). A indicates the anterior-posterior axis, V the ventral-dorsal axis, and L the left-right axis. Scale bars represent 0.1 mm in (C), (D), and (B) and 0.05 mm in (E) and (F). (G) Mean z-scored fluorescence responses of ROIs in the left (N = 840 ROIs) versus right pretectum (N = 991 ROIs). Each mean was direction selective for each directional pair of stimuli, and directional preferences matched the behavioral turning directions. Shaded error bars represent SEM. Green and red colored dots signify visual stimuli driving left turning and right turning, respectively. Horizontal dashed lines mark the peak average responses during the uncorrelated stimulus presentation. Asterisks indicate that all comparisons were significant at the p = 0.01 level (Wilcoxon test). See also Figure S2. |

The Retina Computes Direction-Selective Glider Responses (A) Geometry of the how retinal axons arborize in the central zebrafish brain. Here we show a projected view of a 3D reconstruction of the left hemisphere arborization fields (AFs) using retinal-labeled Tg:Islt2b:SyGCAMP6s zebrafish (7 dpf). Each color highlights a single AF. AF8 is hidden behind AF7 in this view. Because AF5 and AF6 were difficult to distinguish and functionally similar (Figure S3A), we merged them into AF5&6 for most figure panels. Auto-fluorescence artifacts from the eye were masked prior to other data analyses (STAR Methods). P indicates the anterior-posterior axis, V the ventral-dorsal axis, and M the medial-lateral axis. Scale bar represents 50 μm. (B) Example planes showing ROIs identified with our imaging and segmentation routines. We extracted many ROIs from most AFs, but we did not observe functional responses in AF7. A and L indicates the anterior-posterior and left-right axes. Scale bar represents 20 μm. (C) Individual retinal ROIs were consistently activated or suppressed by visual stimuli across the stimulus conditions. We display fluorescence responses from a randomly selected subpopulation of 2,500 ROIs (out of 270,596). The ROIs were sorted by the significance of their selectivity for stimulus-on versus stimulus-off periods across all stimuli (Wilcoxon test). Solid and dashed yellow lines indicate the start and end of stimulus presentation periods respectively. Blue lines mark the p value thresholds (p = 0.05) used to define the activated and suppressed ROI populations. (D) More retinal ROIs were activated and suppressed than expected by chance, and the fraction of ROIs activated or suppressed varied across the AFs. Error bars represent standard error of the mean, and confidence intervals were estimated by assuming Poisson variability in counting statistics (N = AF4: 62,173; AF5&6: 59,450; AF8: 5,676; and AF9: 73,722 ROIs). (E) The number of retinal ROIs that were direction selective for drifting gratings was only above chance levels in AF5&6, as assessed by a shuffle test (STAR Methods). In particular, error bars represent estimated 95% confidence intervals and excluded the chance level of 0 in AF5&6 only. (F) Top: Leftmost column represents two example planes showing a region encompassing AF5 and AF6. ROIs preferring leftward (rightward) gratings are colored cyan (red). Panels in the middle/rightmost columns are from left/right side of the brain. The green boxes in the leftmost panels indicate subregions rotated and shown at higher resolution to the right. A indicates the anterior-posterior axis, and L indicates the left-right axis. Scale bars, left column: 30 μm, all the other columns: 5 μm. Bottom: Z-scored fluorescence traces of the three example ROIs circled in yellow at top. Each ROI was identified by its direction selectivity to drifting grating stimuli, but they also showed direction-selective responses to two-point and three-point glider stimuli. (G) Mean z-scored fluorescence traces of all ROIs direction selective for leftward- or rightward-drifting gratings in the left or right AF5&6. The directional stimulus pairs marked with asterisks were significantly different at the p = 0.01 level (one tailed Wilcoxon test). All other directionally paired stimuli did not show statistically significant differences. N = 240 ROIs (top left), 330 (bottom left), 234 (top right), 449 (bottom right). See also Figure S3. |

Individual Pretectum Neurons Represent Visual Motion Stimuli According to Their Effect on Optomotor Behaviors (A) Schematic of the model architecture (STAR Methods). Mean behavior regressors were first convolved with a temporal kernel that emulated measurable responses in our calcium imaging experiment. The regressors were then combined as a weighted sum, and a final thresholding step captured the non-negativity of the measured pretectal responses. We use N, F, L, and R to denote the Non-specific stimulus-on regressor, the Forward swim frequency regressor, and the Left/Right turn frequency regressors (STAR Methods). For compactness, we illustrate the procedure for the first three stimuli only. (B) Distribution of R-squared values (fraction of variance explained by the model) for all activated ROIs. Note that when the responses of AF5&6 units were fitted similarly, the fraction of variance explained was shifted toward smaller values in comparison with the pretectum case. (C) R-squared maps showing that the quality of model fits was comparable throughout the pretectum. As in Figure 3, we show coronal (center), transverse (top), left sagittal (left), and right sagittal projections (right) overlaid on anatomical maps (grayscale). A indicates the anterior-posterior axis, V the ventral-dorsal axis, and L the left-right axis. Scale bar represents 0.05 mm. (D) Example traces for four pretectum ROIs, together with associated model fits and R-squared values. The first two example ROIs show pretectal neurons that respond to glider stimuli with magnitudes closely matching the behavioral turning frequencies induced by the stimuli. The final two ROIs show that other pretectal neurons responded relatively non-selectively to glider stimuli. (E) Weight coefficient maps for the four regressors used in the model. ROIs utilizing the L or R regressors were localized to the left or right pretectum, respectively. ROIs receiving positive drive from the N or F regressors were localized to the anterior pretectum. All graphical conventions match (C). See also Figures S4 and S5. |