
- Title
-
Mapping the Global Chromatin Connectivity Network for Sox2 Function in Neural Stem Cell Maintenance
- Authors
- Bertolini, J.A., Favaro, R., Zhu, Y., Pagin, M., Ngan, C.Y., Wong, C.H., Tjong, H., Vermunt, M.W., Martynoga, B., Barone, C., Mariani, J., Cardozo, M.J., Tabanera, N., Zambelli, F., Mercurio, S., Ottolenghi, S., Robson, P., Creyghton, M.P., Bovolenta, P., Pavesi, G., Guillemot, F., Nicolis, S.K., Wei, C.L.
- Source
- Full text @ Cell Stem Cell
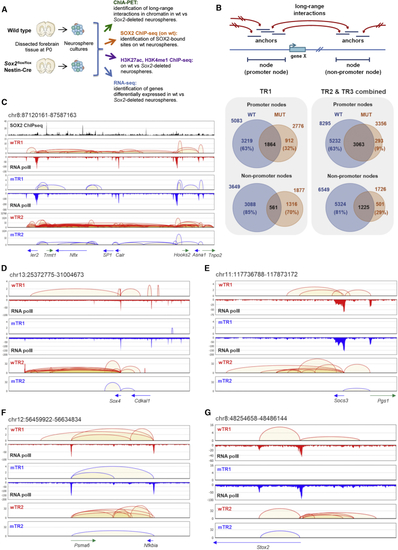
(A) Functional genomics analyses. (B) Top: “anchors” and “nodes” connected by long-range interactions; bottom: numbers of promoter/non-promoter nodes in WT and MUT NSCs, left: TR1 and right: TR2 and TR3 combined. (C–G) Connectivity diagrams in WT NSCs (WT interactions; red) and MUT NSCs (MUT interactions; blue), across 5 different chromosome regions, in the wTR1, wTR2, and mTR1, mTR2 analysis; regions coordinates are: chr8:87120161-87587163 (C), chr13:25372775-31004673 (D), chr11:117736788-117873172 (E), chr12:56459922-56634834 (F) and chr8:48254658-48486144 (G). Their genomic coordinates are indicated above each panel, and genes within each region shown below the panels. Pol II- and SOX2-binding peaks are shown. PET counts (Y axes); note different (log10) scales in some panels. In MUT NSCs, an overall decrease of “looping” is seen, but some interactions are lost, others are maintained. Note the persistence of Pol II binding in MUT NSCs and the frequent coincidence (in C) of SOX2 peaks with interaction anchors. See also |
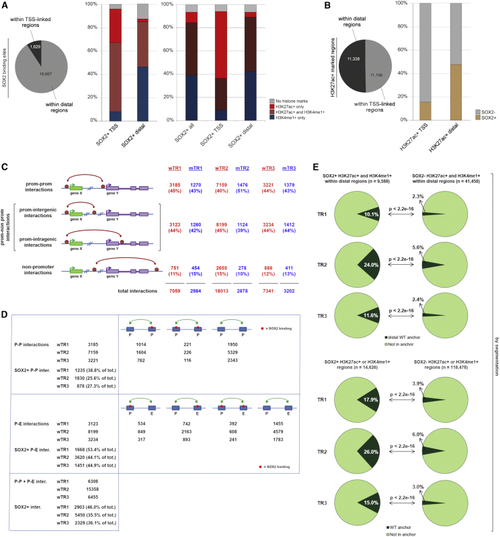
SOX2-Bound Regions Carrying Epigenetic Enhancer Marks (EM) Show Significantly Higher Overlap with Anchors Than SOX2-Negative EM-Positive Regions (A) Left: number of SOX2-bound sites in regions linked to annotated TSS (±1,000 nt) and in distal, non-P regions. Right (histograms): percentage of different enhancer marks (EMs)-positive regions within SOX2-bound TSS-linked (SOX2+ TSS) or distal (SOX2+ distal) regions (left histograms, peak calling; right histograms, chromHMM). (B) Fraction of SOX2-bound sites within EM-positive regions (H3K27Ac+) on TSS-linked or distal regions (peak calling). (C) Interaction types according to the nature of the connected regions, for wTR1, wTR2, wTR3, mTR1, mTR2, and mTR3. “Prom,” annotated TSS-containing region (i.e., promoter). (D) Numbers of P-P and P-nonP (P-E) SOX2-positive interactions in WT cells in wTR1, wTR2, and wTR3. See also (E) Fraction of SOX2+ (left) versus SOX2− (right) EM-positive regions that overlap with anchors in wTR1, wTR2, and wTR3. Top: distal epigenetically marked regions (H3K27Ac+ and H3K4me1+) overlap with distal anchors. Bottom: all epigenetically marked regions (H3K27Ac+ or H3K4me1+) overlap with all anchor types, chromHMM. See also |

Distal Anchors Connected by (A and B) (C and D) See also |
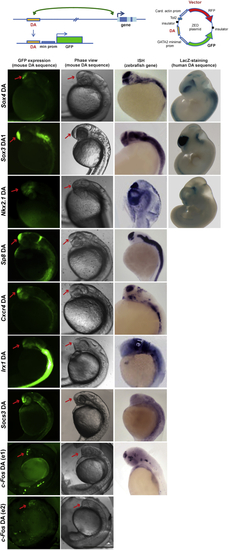
Distal Anchors in Top: enhancer-dependent GFP-reporter (ZED): distal anchors (DA) from See also |
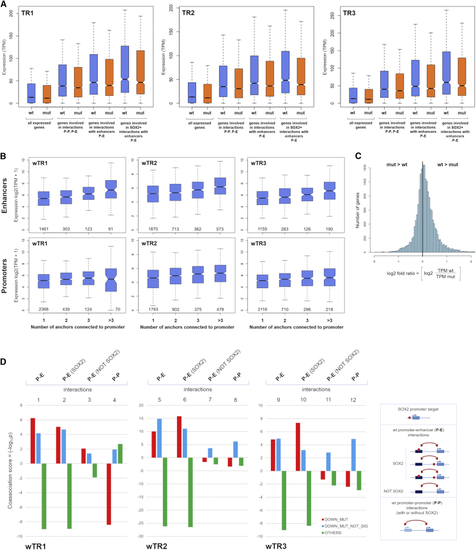
Reduced Gene Expression in (A) Distribution of expression values (TPM) of genes with TPM >0. Blue, WT NSCs; orange, MUT NSCs. From left to right: all genes; genes whose promoter is a node (P-P, P-E interactions); genes whose promoter is connected to an enhancer (P-E interactions); genes with SOX2-positive P-E interactions. (B) Distribution of expression values (y axis) of genes according to the number and type of element (enhancer or promoter anchors) interacting with the gene promoter (x axis) in wTR1, wTR2, and wTR3. Top: interactions with enhancers. Bottom: interactions only with promoters. The number of genes involved is shown in each diagram inside the box along the x axis. (C) Distribution of the fold ratio values for all genes with TPM >0 defined as log2 (TPM_WT/TPM_MUT). It confirms results shown in (B): the fold ratio is shifted toward positive values (i.e., a majority of genes have expression in WT higher than in MUT NSCs). (D) Coassociation scores (histograms, -log10 See also |
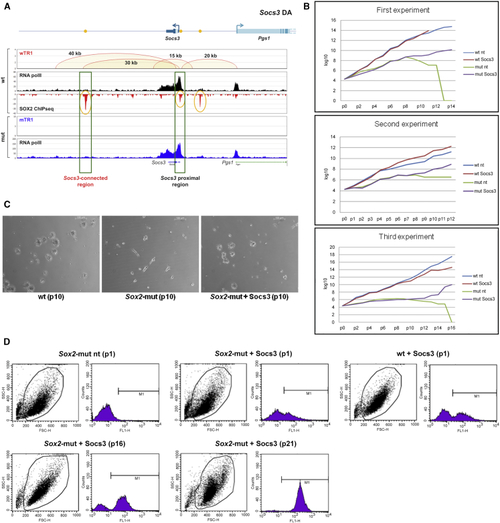
SOCS3 Re-expression in MUT NSCs Prevents NSC Exhaustion and Restores Self-Renewal (A) Top: (B) Growth curves of MUT NSCs, not transduced (MUT) or transduced (MUT (C) Images (phase-contrast) of MUT or (D) FACS analysis (GFP) of MUT, WT, and MUT |