
- Title
-
TLD1433 Photosensitizer Inhibits Conjunctival Melanoma Cells in Zebrafish Ectopic and Orthotopic Tumour Models
- Authors
- Chen, Q., Ramu, V., Aydar, Y., Groenewoud, A., Zhou, X.Q., Jager, M.J., Cole, H., Cameron, C.G., McFarland, S.A., Bonnet, S., Snaar-Jagalska, B.E.
- Source
- Full text @ Cancers

( |

Cell viability after TLD1433 treatment of eight tumour cell lines (CRMM1, CRMM2, CM2005.1, OMM1, OMM2.5, MEL270, A431, A375). The green line shows TLD1433 activated by 520 nm light, 21 mW/cm2, 19 J.cm−2 (light-induced toxicity). The dark line shows TLD1433 treatment without light irradiation (dark toxicity). The tumour cells were treated with TLD1433 for 24 h with concentrations ranging from 0.001 µM to 5 µM and kept in the dark, or ranging from 0.0001 µM to 0.025 µM and illuminated with a light dose of 21 mW/cm2, 19 J/cm2. SRB assay was carried out at 48 h after light irradiation. The absorbance of Sulforhodamine B in solution was measured at 520 nm. Results are presented as means ± SD from three independent experiments with 95% confidence intervals. |
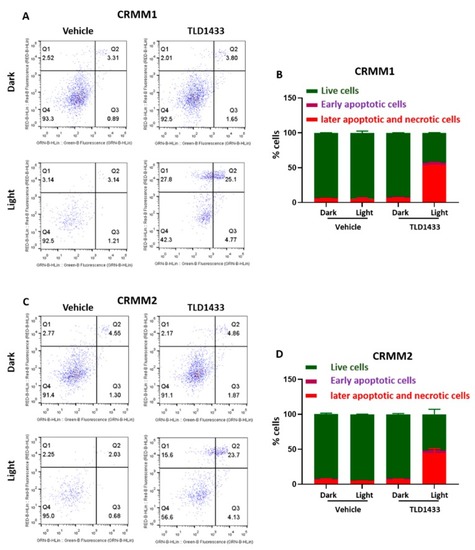
Green light irradiation of TLD1433 induces apoptosis and necrosis in CRMM1 and CRMM2 cells. ( |

Light toxicity in zebrafish embryos. 2 dpf embryos ( |

The maximum tolerated dose of TLD1433 in wild type zebrafish embryos administered through three different routes. ( |
The maximum tolerated dose of TLD1433 in wild type zebrafish embryos administered through three different routes. ( |

Development of a new conjunctival melanoma orthotopic tumour model in ZF. ( |
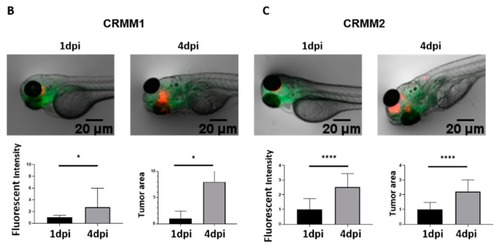
Development of a new conjunctival melanoma orthotopic tumour model in ZF. ( |

Treatment of zebrafish ectopic and orthotopic CM models with TLD1433 through WA. ( |

TLD1433 treatment by IV administration in the zebrafish ectopic and orthotopic CM model. ( |

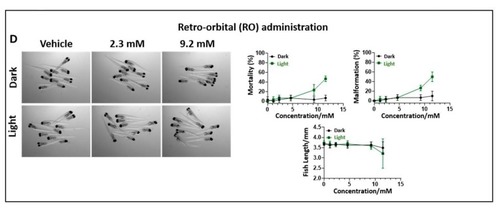
TLD1433 treatment by RO administration in the zebrafish ectopic and orthotopic CM model. ( |

TUNEL assay of in CRMM1 and CRMM2 orthotopic model after RO of TLD1433. Red fluorescent CRMM1 ( |
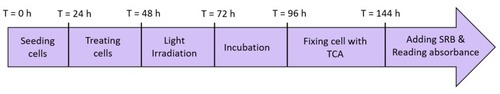
Time line for the SRB assay. |