
- Title
-
Transcriptomic Analyses of Inner Ear Sensory Epithelia in Zebrafish
- Authors
- Yao, Q., Wang, L., Mittal, R., Yan, D., Richmond, M.T., Denyer, S., Requena, T., Liu, K., Varshney, G.K., Lu, Z., Liu, X.
- Source
- Full text @ Anat. Rec. (Hoboken)
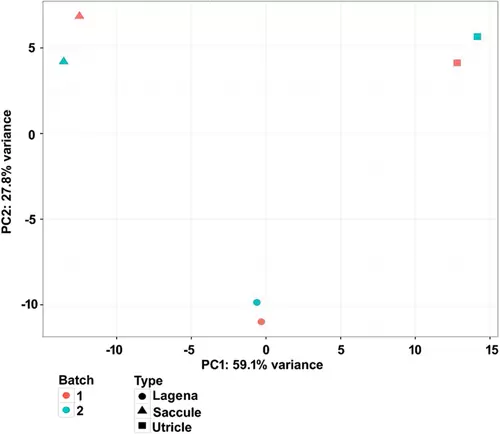
PCA of microarray expression levels across three different otolith organs in zebrafish. The x-axis represents the greatest source of variance across all samples and the y-axis represents the second greatest. Each symbol represents the results of one microarray hybridization, as indicated in the legend. Red symbols represent RNA samples from the first batch and blue symbols represent RNA samples from the second batch. Six samples are well grouped by different otolith organs, indicating that there is less variance between samples of the same otolith organs than between two different batches. The two greatest principal components account for 86.9% (59.1% + 27.8%) of the variance. |
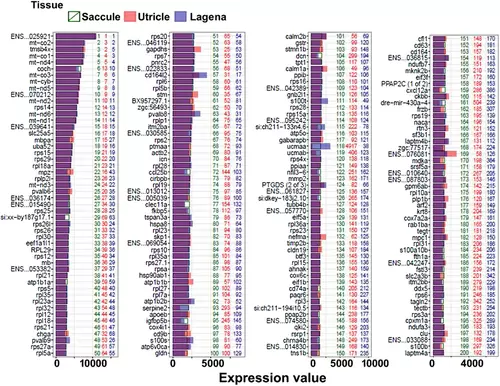
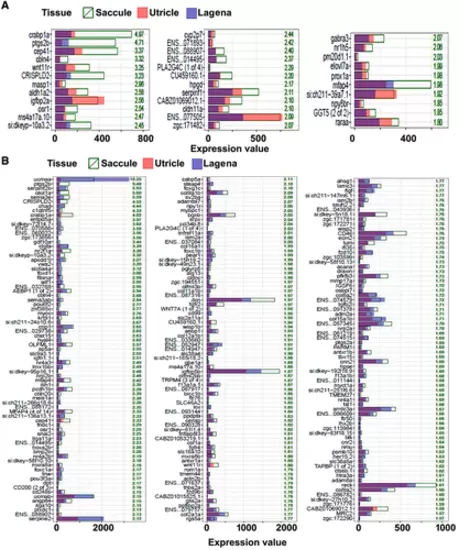
Expression levels of top 200 genes in the saccule. The bars show the fluorescent density of each gene after normalization. Numbers in green, red, and blue signify the abundance rank of the genes in the saccule, utricle, and lagena, respectively. In this and all subsequent figures, the last six digits of ENSMUST identification numbers are used. |
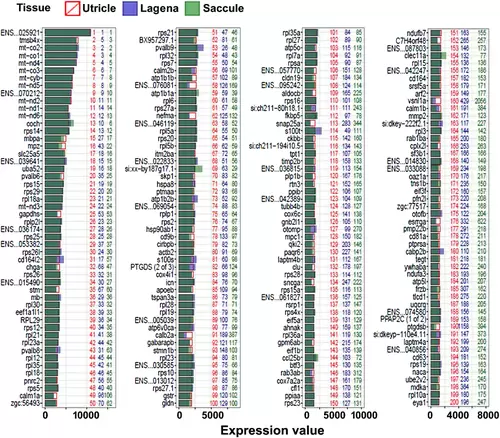
Expression levels of top 200 genes in the utricle. The bars show the fluorescent density of each gene after normalization. Numbers in green, red, and blue represent the abundance rank of the genes in the saccule, utricle, and lagena respectively |
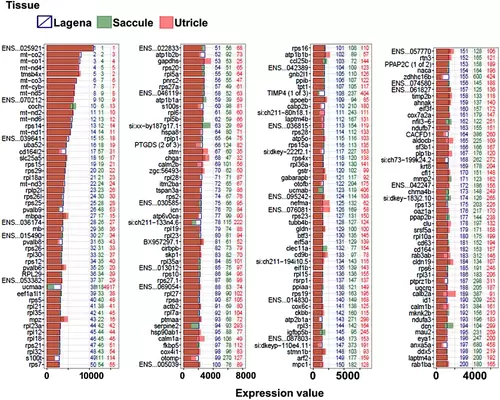
Expression levels of top 200 genes in the lagena. The bars show the fluorescent density of each gene after normalization. Numbers in green, red, and blue represent the abundance rank of the genes in the saccule, utricle, and lagena respectively. |
Differentially expressed genes in Saccule. The numerical values represent the fold difference in expression in the saccule versus the lagena (A) or the saccule versus the utricle (B). |
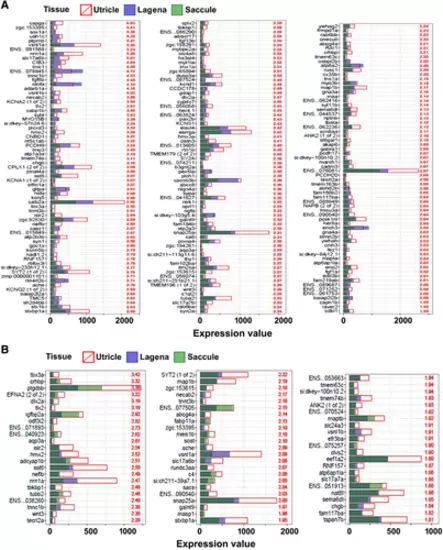
Differentially expressed genes in the utricle. The numerical values represent the fold difference in expression in the utricle versus the saccule (A) or the utricle versus the lagena (B). |
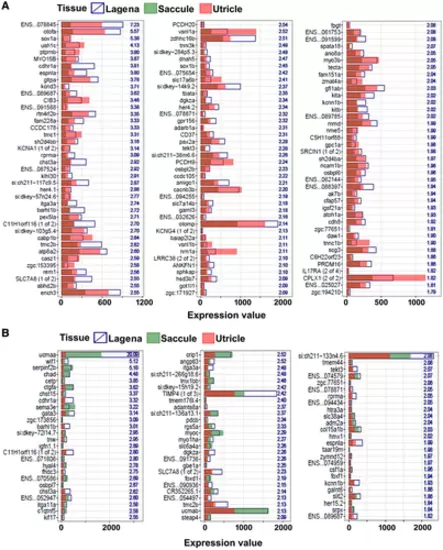
Differentially expressed genes in the lagena. The numerical values represent the fold difference in expression in the lagena versus the saccule (A) or the lagena versus the utricle (B). |
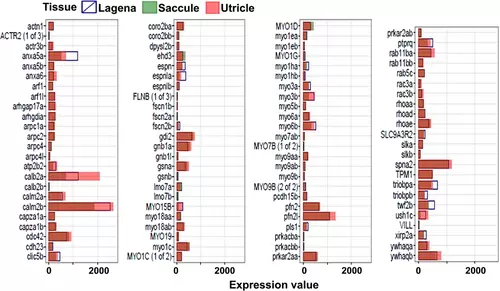
Expression level of genes associated with to stereocilia structure in the saccule, utricle and lagena. |
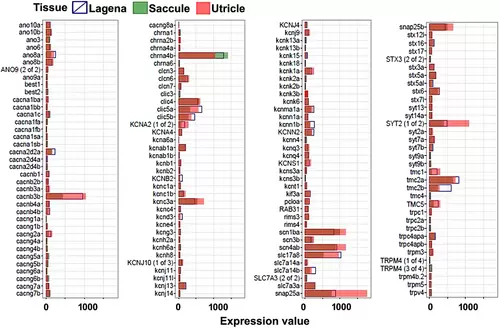
Expression level of genes associated with to Ion channels in the saccule, utricle and lagena. |
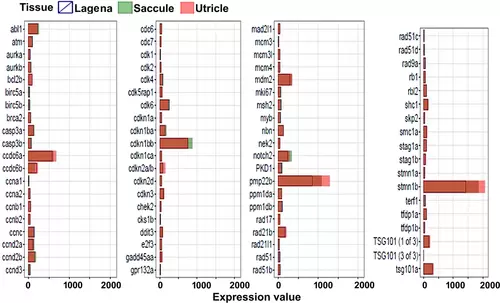
Expression level of genes associated with cell cycle in the saccule, utricle and lagena. |
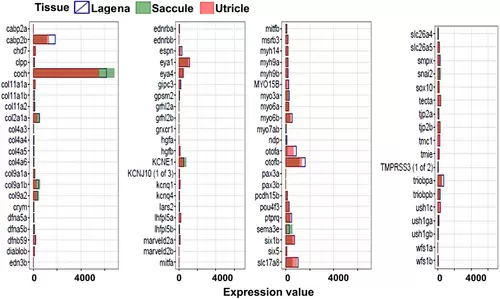
Expression level of genes associated with deafness in the saccule, utricle and lagena. |
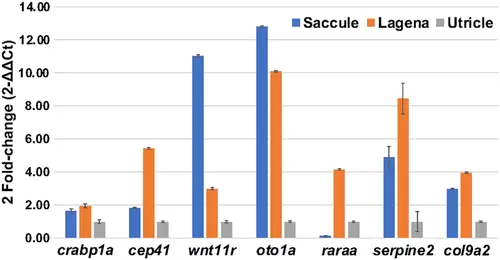
Expression levels of genes in the saccule and lagena using qRT-PCR; values from the utricle were used for normalization. |