
Image
|
Figure Caption
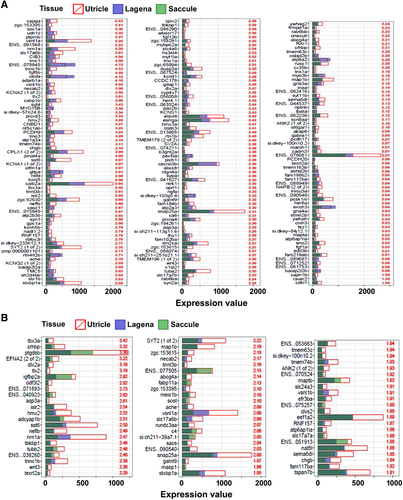
Fig. 6 Differentially expressed genes in the utricle. The numerical values represent the fold difference in expression in the utricle versus the saccule (A) or the utricle versus the lagena (B).
Acknowledgments
This image is the copyrighted work of the attributed author or publisher, and
ZFIN has permission only to display this image to its users.
Additional permissions should be obtained from the applicable author or publisher of the image.
Full text @ Anat. Rec. (Hoboken)