FIGURE SUMMARY
Title

Fast objective coupled planar illumination microscopy

Authors
Greer, C.J., Holy, T.E.
Source
Full text @ Nat. Commun.

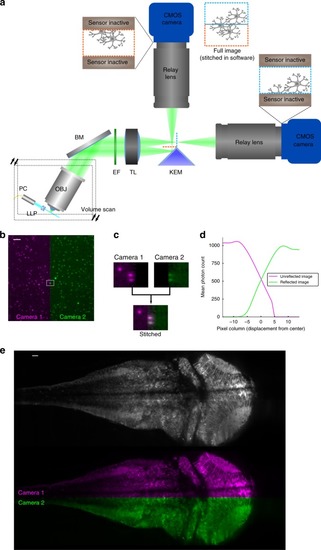
Mitigating the camera bottleneck. a A two-camera shared-image OCPI system. A knife-edged prism mirror (KEM) takes the place of the camera sensor in Fig. 1b. The mirror is aligned so that half of the image is reflected and relayed to a camera above while half passes unimpeded and is relayed to a second camera. Cameras are aligned so that they image a centered horizontal band in the field of view. The two cameras expose synchronously, and their images are later stitched together into a full image. Since the frame rate of a CMOS camera depends only on image height (Fig. 1e) this doubles the imaging speed of the system. b Example stitched image of fluorescent beads (0.2 μm diameter) with one camera’s image in magenta and the other in green. Scale bar: 20 μm. c Zoomed view of the rectangular region marked in panel b showing a pair of beads in the narrow region imaged by both cameras, corresponding to the apex of the KEM. d Quantification of a stitched image of fluorescene dye solution with the same width and location as shown in panel c. The width of the redundant image region is approximately 10 pixels (less than 0.3% of the camera chip width). e Pseudocolored and grayscale views of the same stitched slice of a larval (5 dpf, HuC:GCaMP6s) zebrafish brain. Scale bar: 20 μm

20 Hz imaging of zebrafish forebrain. a Maximum intensity projection of voxelwise F (grayscale) and ΔF/F (magenta) along the dorsal-ventral axis of the larval zebrafish forebrain (5 dpf) with pan-neuronal GCaMP6f expression (HuC:GCaMP6f) acquired at 20 stacks/s at 10× magnification (Supplementary Movie 2). Only voxels with greater than 15% ΔF/F are colored. b Raster plot of ΔF/F within 629 manually segmented neuron ROIs over a 4 min period. Shown is an excerpt from a 20 min recording. ROIs were drawn smaller than the size of each cell in an attempt to minimize the effects of motion artifacts and cross-talk between nearby neurons. c Neurons exhibit a range of pairwise correlations in the ΔF signal. Correlations were computed with highpass-filtered neuron traces (1.0 Hz cutoff) in order to focus on relationships revealed by high sampling rate. Neurons are ordered by axial depth in the forebrain (dorsal to ventral). d Power spectra of the ΔF signals for a subset of neurons show that power diminishes gradually with increasing frequency. These and many other neurons exhibit peaks in their spectra at 2.5 Hz and 7.5 Hz that correspond with the larval zebrafish heart rhythm35. e Bandstop filters were applied to remove the heartbeat frequency bands (see Methods section) before recomputing correlations. Shown is the matrix of differences in correlation values obtained before and after heartbeat artifact removal (corrafter − corrbefore). Thus this matrix highlights spurious correlations due to heartbeat that could contaminate a naive analysis of neuronal activity

Acknowledgments
This image is the copyrighted work of the attributed author or publisher, and ZFIN has permission only to display this image to its users. Additional permissions should be obtained from the applicable author or publisher of the image. Full text @ Nat. Commun.