
- Title
-
Embryonic Exposure to Bisphenol A Impairs Primordial Germ Cell Migration without Jeopardizing Male Breeding Capacity
- Authors
- Lombó, M., Getino-Álvarez, L., Depincé, A., Labbé, C., Herráez, M.P.
- Source
- Full text @ Biomolecules

(A) Number of primordial germ cells (PGCs) observed in the genital ridge of embryos at 24 h post fertilization (hpf). Bars represent mean of PGCs in 5 embryos at 24 hpf in 3 different experiments (n = 3). Asterisks indicate significant differences (p < 0.05) when compared to control groups. (B) Location of PGCs (green fluorescence) by confocal imaging in 24 hpf embryos. In control embryos (left picture), they were located within the genital ridge (arrowhead); scale bar 100 µm. The inset region is enlarged in the middle picture, in which germ cells are marked with Vasa (green spots surrounding nuclear area stained with DAPI); scale bar 10 µm. In 24 hpf embryos exposed to 4000 µg/L BPA (right picture), PGCs appeared outside the genital ridge (arrowhead); scale bar 100 µm. (C) Relative expression of genes involved in primordial germ cell migration in the genital ridges of control and BPA-exposed embryos. Expression levels relative to 18 S rRNA were calculated using 2−ΔCt method in three independent experiments (n = 3). Asterisks indicate significant differences (p < 0.05) when compared to control embryos. |
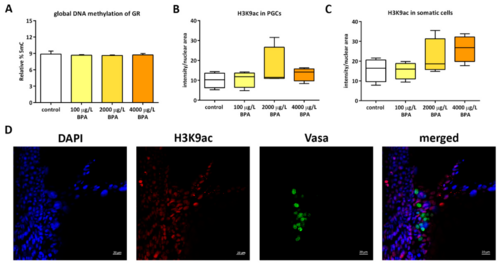
Epigenetic profile of PGCs and their somatic surrounding cells. (A) Quantification of 5 mC by UPLC-MS in DNA of genital ridges (GR) from control and BPA-treated embryos. Bars represent the percentage of 5mC relative to C in 3 pools of 20 genital ridges per treatment (n = 3). Quantification of H3K9ac by whole mount immunofluorescence in (B) germ cells and (C) somatic cells of 24 hpf control and BPA-exposed embryos. Boxes represent the median plus maximum and minimum of H3K9ac intensity relative to nuclear area in 4 independent experiments (n = 4). (D) confocal images of double immunostaining in genital ridges of 24 hpf control embryos. H3K9ac was labelled with AlexaFluor®568 (red fluorescence), Vasa protein within PGCs was labelled with AlexaFluor®488 (green fluorescence) and nuclei were stained with DAPI (in blue); scale bar 20 µm. |

Evaluation of testicular status in adult males. (A) GSI (gonado-somatic index) of testicles from 5 control and 5 BPA-exposed fish in each of the 3 different replicates (n = 3). (B) morphometric study showing the percentage of each cell type: sg (spermatogonia), sc (spermatocyte), st (spermatid), and sz (spermatozoa) of both testicles from 3 different males per treatment (n = 3). (C) representative images of testicular cell types in control and treated fish. 4 µm-slices were stained with hematoxylin-eosin; scale bar 20 µm. |

Epigenetic profile of spermatozoa. (A) bars represent the percentage of global DNA methylation in spermatozoa of 3 pools of sperm from 5 control and 5 exposed fish each (n= 3). (B) bars represent the intensity of H3K9ac labelled with AlexaFluor®488 of 3 pools of sperm from 5 control and 5 exposed fish (n = 3); asterisks indicate significant differences (p < 0.05) when compared to control males. (C) confocal images of H3K9ac in spermatic nuclei (stained with DAPI); scale bar 5 µm. |
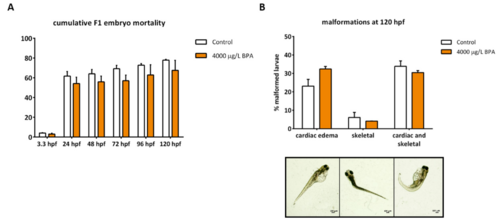
Evaluation of F1 embryonic development. (A) cumulative percentage of embryo mortality from 3.3 to 120 hpf of six independent matings per treatment (n = 6). (B) percentage of malformed larvae at 120 hpf of six independent batches per treatment (n = 6). No significant differences between treatments (p < 0.05) were found. Images represent the main type of malformations: cardiac edema, skeletal and altogether; scale bar 100 µm. |