FIGURE SUMMARY
Title

Discovering the chloride pathway in the CFTR channel

Authors
Farkas, B., Tordai, H., Padányi, R., Tordai, A., Gera, J., Paragi, G., Hegedűs, T.
Source
Full text @ Cell. Mol. Life Sci.

Channels with extracellular and intracellular ends. Tunnels suitable for chloride conductance were identified in one case out of 22 equilibrium simulations with the ATP-bound CFTR structure (PDBID: 5W81) using Caver. The channels with top scores (spheres with red colors) were clustered based on the atom positions of the channel-lining residues. Intracellular residues with positive charges at the TM4/6 entry site are labeled with blue sticks. Lasso/L0 region, TMD1, TMD2, NBD1, and NBD2 domains are marked with dark green, pale green, green, yellow, and orange, respectively. Lipid molecules lining the pore in the region of TM8 are shown by black sticks. a, b Side views from the bilayer hydrophobic core. c A top view from the extracellular space

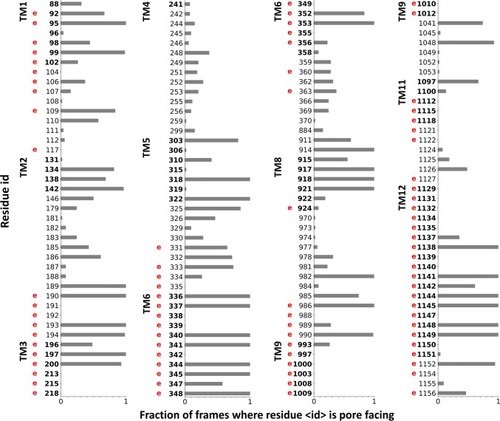
Comparing channel-lining residues identified in simulations to experimental data. Residues interacting with the Caver spheres were counted from all open frames (n = 54) and normalized. Only residues lining the channel based on in silico or in vitro data, are indicated in the plot. A letter “e” in red was placed at the residue number (human numbering) to indicate that the residue had been shown by laboratory experiments to influence the CFTR chloride conductance. Bold numbers indicate amino acids located in the TM region

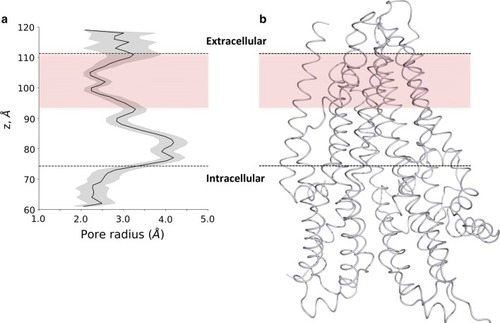
The chloride channel profile. a The Caver sphere radius from all open channels was averaged over z coordinates. The large inner vestibule is indicated by large values (up to 4 Å), while bottleneck regions in the extracellular leaflet and in the intracellular region are characterized by radius values between 2 and 2.5 Å. The bottleneck in the extracellular membrane leaflet is depicted by the light coral box area. b The 3D structures of transmembrane domains are shown in the context of the channel profile

Interaction sites of chloride ions with the CFTR protein. Contact sites are depicted by stick representation of amino acids and color-coded according to the contact frequency from green (low) to red (high). a TMD1 and the chloride entry pore at K370, between TM4 and TM6 are shown. b TMD2 and the pore close to the L0/Lasso motif (black), between TM10 and TM12 are depicted. TM4, TM6, TM10 and TM12 are colored by blue, salmon, cyan, and purple, respectively. The entry pores are circled (red)

Chloride ions entered the pathway but did not pass. a The positions of two chloride ions (#1 light blue and #2 blue), entering the protein, are shown by blue lines. Black lines indicate the boundaries of the membrane bilayer determined by the center of mass of P atoms in POPC molecules. Vertical magenta lines mark frames with an open pathway. b The locations of Cl #2 from every frame are shown with blue dots in the context of the initial structure. The contact frequency of this chloride ion with the protein was projected onto the structure and color coded from green (low) to red (high). Residues with the highest interaction frequencies are K95 and R134 (red)

Coupling helix 4 dynamics is strongly coupled to the bottleneck region. Optimal and suboptimal paths in the network of amino acids (spheres), connected by edges (lines) corresponding to correlation in motions, were determined. Number of suboptimal paths between coupling helix 4 (CH4, L1065) and R334 (a) is significantly higher than paths from any other coupling helix, such as from coupling helix 2 (CH2, V272) to R334 (b). Red: optimal paths; blue: suboptimal paths; orange: source residue; yellow: sink residue

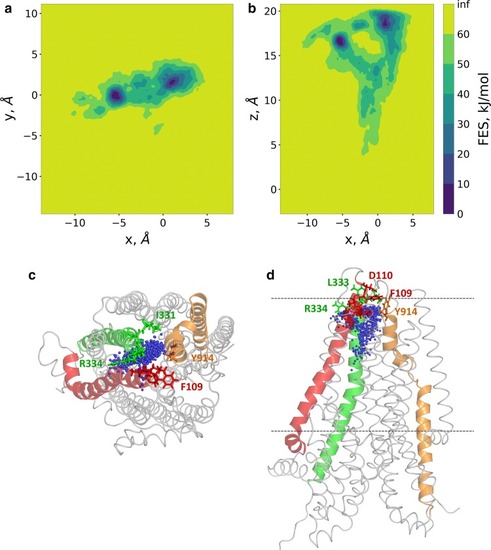
Two routes towards the extracellular regions were detected by metadyanamics simulations. Well-tempered metadynamics simulations were performed to identify potential exit routes of chloride ions and the amino acids narrowing this region of the pathway. The distance between the center of mass of four Cα atoms (a.a. 95, 347, 924, and 1141) and Cl #2 was used as a reaction coordinate (collective variable, CV). 2D free energy surfaces were calculated along the x, y, and z components of this distance CV and plotted (panels a, b). Top (panel c) and side (panel d) views of chloride ions from every 100th frames are shown by blue spheres in relation to the initial structure. TM1, TM6, and TM8 are colored by red, green, and orange, respectively. Sticks represent the following amino acids in the bottleneck region: I106, A107, Y109 (F in zCFTR), D110 (TM1), I331, I332 (N in zCFTR), L333, R334 (TM6), Y914 (TM8)

Acknowledgments
This image is the copyrighted work of the attributed author or publisher, and ZFIN has permission only to display this image to its users. Additional permissions should be obtained from the applicable author or publisher of the image. Full text @ Cell. Mol. Life Sci.