FIGURE SUMMARY
Title

Dephosphorylation of HDAC4 by PP2A-Bδ unravels a new role for the HDAC4/MEF2 axis in myoblast fusion

Authors
Veloso, A., Martin, M., Bruyr, J., O'Grady, T., Deroanne, C., Mottet, D., Twizere, J.C., Cherrier, T., Dequiedt, F.
Source
Full text @ Cell Death Dis.

PP2A-Bδ holoenzyme is necessary for myofiber formation <italic>in vivo</italic>.

a, b Quantification of the curved trunk phenotype (a) and b representative confocal imaging in 48-hpf zebrafish embryos injected with a control morpholino (CTL Mo), with an ATG-blocking morpholino alone (Bδ Mo1) or together with a rat Bδ (Bδ Mo1 + rBδ) or rat Bα mRNA (Bδ Mo1 + rBα) or an alternative splice-blocking morpholino (Bδ Mo2) against PP2A-Bδ. Nuclei (Hoechst) and fast skeletal myosin are shown respectively in green and red. Scale bars are 25 µm. c Quantification of the number of nuclei in fast skeletal myofibers in 48-hpf control embryos (CTL Mo, n = 16) or in embryos injected with the PP2A-Bδ Mo alone (Bδ Mo, n = 20) or together with a rat Bδ (Bδ Mo + rBδ, n = 7) or rat Bα mRNA (Bδ Mo1 + rBα, n = 9). Values are mean ± SD, unpaired t-test, two-tailed, ****P< 0.0001. d Proportion of fibers with the indicated number of nuclei in control (CTL Mo, n = 11) or PP2A-Bδ (Bδ Mo, n = 14) morphant embryos

PP2A-Bδ is involved in fusion-associated cytoskeleton morphogenesis.

a Representative (n = 2) confocal images of morphology of wild-type (WT), control (shCTL), and Bδ-knocked down (shBδ) C2C12 myoblasts at the indicated time points during the differentiation process. Cells were stained with CellMask (white). Scale bars are 25 µm. b Major/minor cell axis ratio in wild-type (n = 21), control (shCTL, n = 29), and Bδ-knocked down (shBδ, n = 27) C2C12 myoblasts at day 2 during the differentiation process. Kruskal–Wallis with Dunn’s correction, *P< 0.05, **P< 0.01. ns: not significant. c Confocal analysis of F-actin (phalloidin, gray) in control (shCTL) and Bδ-knocked down (shBδ) C2C12 myoblasts grown in GM (d0) or 2 days in DM (d2). Representative images from two experiments are shown. Scale bars are 10 µm. d Representative (n = 3 experiments) confocal imaging of F-actin (phalloidin, green) in 48-hpf control (CTL Mo) or PP2A-Bδ (Bδ Mo1) morphant embryos. Scale bars are 25 µm

PHENOTYPE:
Fish:
Knockdown Reagent:
Observed In:
Stage: Long-pec

PP2A-Bδ holoenzyme regulates cytoskeleton dynamics via the RhoGTPase Rac1.

a Rac1 activity was measured by GST pull-down assay in control (shCTL) and Bδ-knocked down (shBδ) C2C12 myoblasts at the indicated time points during the differentiation process. Values are mean ± SD from at least three experiments. Unpaired t-test, two-tailed, *P< 0.05. b Western blot analysis of phospho-Pak1,2 (α-pPAK1,2) and total Pak 1,2 (α-PAK1,2) in control (shCTL) and Bδ-knocked down (shBδ) C2C12 myoblasts at the indicated time points during the differentiation process. Images are representative of two independent experiments. c Confocal analysis of F-actin (phalloidin, gray) in control (shCTL) and Bδ-knocked down (shBδ) C2C12 myoblasts treated ( + ) or not (−) with a Rac1 inhibitor (NSC23766). Imaging was done at the indicated time points during the differentiation process. Representative cells from two independent experiments are shown. Scale bars are 10 µm. d Major/minor cell axis ratio in control Bδ-KD (shBδ) C2C12 myoblasts treated or not with the NSC23766 Rac1 inhibitor. Analysis was performed at day 2 during the differentiation process. Cells from 2 independent experiments for each condition were analyzed (n = 570 for shBδ and n = 585 for shBδ + Rac inhibitor). Mann–Witney’s test ****P< 0.0001. e Analysis of Abl, CrkII, and FAK activation by western blot in control (shCTL) and Bδ-KD (shBδ) C2C12 myoblasts during differentiation using antibodies against the phosphorylated forms of their activation sites, i.e., Y412 (α-pAbl (Y412)), (α-pCrkII (Y221)), and (α-pFAK (S273)), respectively. In total, Abl, CrkII, and FAK were used as loading controls. Images are representative of at least two experiments

PP2A-Bδ controls myoblast fusion through regulation of <italic>ArgBP2</italic> expression.

a RT-qPCR analysis of ArgBP2 mRNA levels in control (shCTL) and Bδ-KD (shBδ) C2C12 myoblasts during differentiation. Values are mean ± SD from three independent experiments. Two-way anova, with Bonferroni correction, ****P< 0.0001, **P< 0.01. b Fusion index of control (shCTL) and Bδ-knocked down (shBδ) C2C12 myoblasts transfected with a control siRNA or an siRNA against ArgBP2 (siArgBP2) from three independent experiments. One-way anova, with Tukey’s post-hoc test. **P< 0.01, ****P< 0.001. c–e Quantification of the curved trunk phenotype (c), d confocal imaging of F-actin (phalloidin, green, n = 10 for CTL Mo and n = 15 for Bδ Mo) and e quantification of the number of nuclei in fast skeletal myofibers of in 48-hpf zebrafish embryos injected with a control morpholino (CTL Mo, n = 5), or with a Bδ morpholino alone (Bδ Mo1, n = 3) or together with an ArgBP2 morpholino (Bδ Mo + ArgBP2 Mo, n = 10). Scale bars are 25 µm. One-way anova with Tuckey’s post-hoc test, **P< 0.01, *P< 0.05, ns: not significant

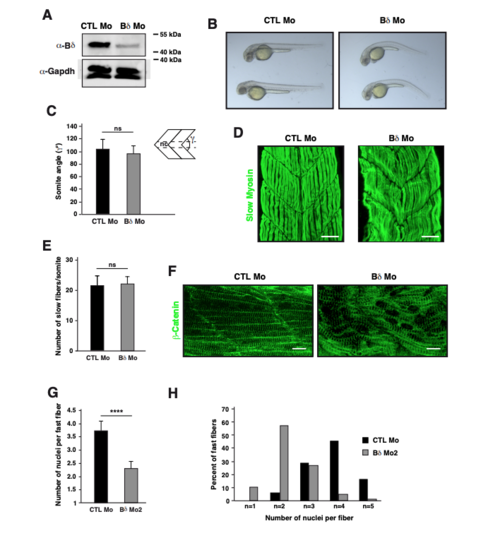
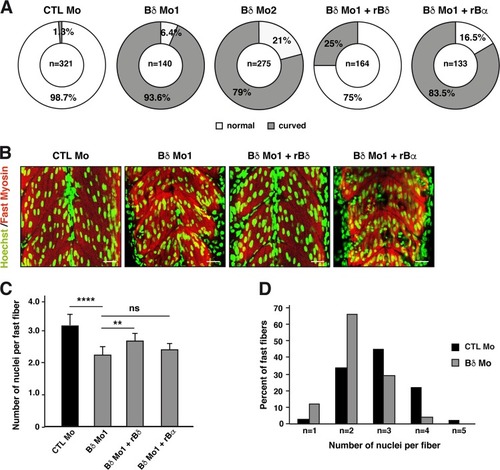
Knockdown of PP2A-Bδ in zebrafish embryos. (A) Western blot analysis of Bδ (α-Bδ) in 48 hpf zebrafish embryos injected with control morpholino (CTL Mo) and a morpholino targeting zebrafish Bδ orthologue (Bδ Mo). GAPDH (α-GAPDH) was used as loading control. Images are representative experiments from 2 independent experiments. (B-E) (B) Bright field pictures representative of at least 10 independent experiments, (C) quantification of somite angles (γ; nc: notochord), (D) visualization of slow twitch myotome by confocal microscopy and staining for slow skeletal myosin (green) and (E) quantification of slow fibers in each somite of 48 hpf zebrafish embryos injected with control morpholino (CTL Mo, n=8 for (C,D) and n=10 for (E)) or a morpholino against Bδ (Bδ Mo, n=17 for (C,D) and n=9 for (E)). Unpaired two-tailed t-test, *** P<0.001, ns: not significant. (F-H) (F) Confocal pictures of β-catenin (green) highlighting striations, (G) quantification of the number of nuclei per fiber and (H) proportion of fibers with the indicated number of nuclei in fast myofibers of control (CTL Mo, n=8 for (F) and n=5 for (G,H)) or PP2A-Bδ (Bδ Mo, n=17 for (F) and n=7 for (G,H)) morphant embryos. Unpaired two-tailed t-test, **** P<0.0001, ns: not significant.

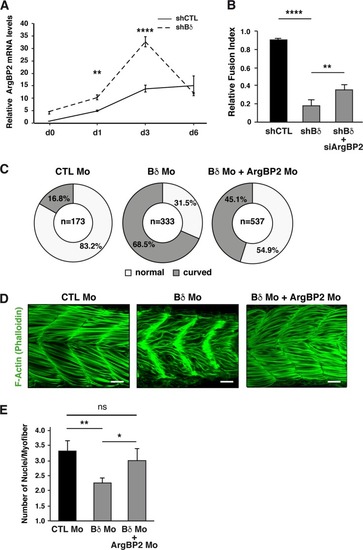
PP2A-Bδ controls expression of ArgBP2 via HDAC4. (A) Western blot analysis of ArgBP2 levels in C2C12 myoblasts transfected with a control (siCTL), anti-HDAC4 (siHDAC4) or anti-HDAC5 (siHDAC5) siRNA. GAPDH (αGAPDH) was used as loading control. (B) ChIP analysis of MEF2 binding to the ArgBP2 promoter in control (shCTL) and BδKD (shBδ) C2C12 myoblasts at day 3. Immunoprecipitations were realized with a control IgG or an anti-MEF2 antibody. Results are expressed as mean percent of input ± SD, relative to the control IgG and standardized to shCTL cells, from 3 independent experiments, unpaired two-tailed t-test, *** P<0.001. (C) Western blot analysis of ArgBP2 (α-ArgBP2) in control (shCTL) and Bδ-knocked down (shBδ) C2C12 myoblasts at the indicated time points during the differentiation process. GAPDH (α-GAPDH) was used as loading control. Images are representative of 2 independent experiments. (D) Analysis of ArgBP2 (α-ArgBP2) and activity of CrkII as assessed by phosphorylation of its inhibitory Y221 (α-pCrkII (Y221)) in control (shCTL) and Bδ-knocked down (shBδ) C2C12 myoblasts transfected with a control siRNA or a siRNA against ArgBP2 (siArgBP2). GAPDH (α-GAPDH) and total CrkII (α-CrkII) were used as loading control. (E) Major/minor cell axis ratio in control (shCTL) and Bδ-knocked down (shBδ) C2C12 myoblasts grown in GM and transfected with a control siRNA or an siRNA against ArgBP2 (siArgBP2). Results were calculated on >200 cells/experiment from 2 independent experiments, unpaired two-tailed t-test, **** P<0.0001. (F) Representative confocal pictures of fast skeletal myosin (red) and β-catenin (white) in control (CTL Mo, n=6 independent experiments) or PP2A-Bδ (Bδ Mo, n=6 independent experiments) morphant embryos, injected with morpholino against ArgBP2 (ArgBP2 Mo, n=10 independent experiments). Nuclei of fast skeletal fibers were stained with Hoechst (green). Scale bars are 100µm

Acknowledgments
This image is the copyrighted work of the attributed author or publisher, and ZFIN has permission only to display this image to its users. Additional permissions should be obtained from the applicable author or publisher of the image. Full text @ Cell Death Dis.