
- Title
-
Zebrafish macroH2A variants have distinct embryo localization and function
- Authors
- Gonzalez-Munoz, E., Arboleda-Estudillo, Y., Chanumolu, S.K., Otu, H.H., Cibelli, J.B.
- Source
- Full text @ Sci. Rep.
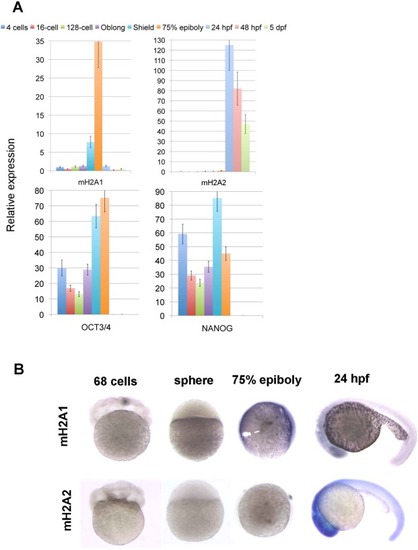
Zebrafish mH2A expression pattern during early embryo development. Wild type zebrafish embryos were collected at different developmental stages. ( |
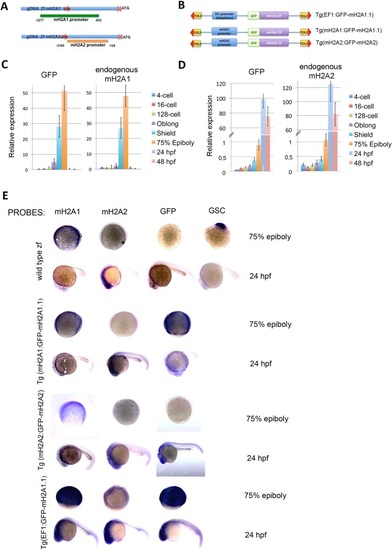
Identification and characterization of mH2A promoter regions and fusion proteins during embryogenesis. ( |
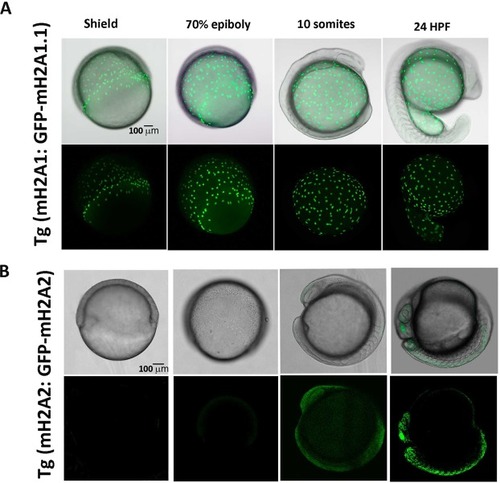
GFP-mH2A1.1 and GFP-mH2A2 protein expression under endogenous promoter during zebrafish embryogenesis show distinct temporal and location pattern. |
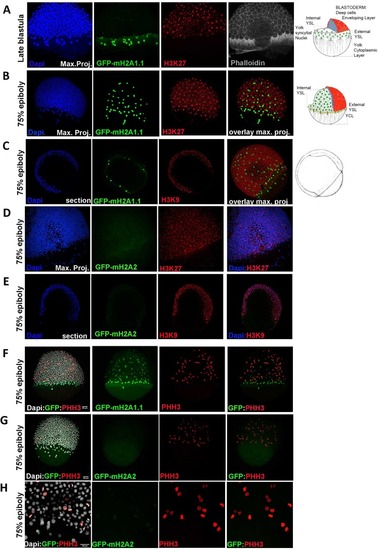
mH2A isoforms differential colocalization with heterochromatin and mitotic marks in zebrafish embryos at epiboly stage. Transgenic zf embryos expressing mH2A1:GFP-mH2A1.1 ( |

mH2A isoforms differential colocalization with heterochromatin and mitotic marks in zebrafish embryos at 24 hpf stage. Transgenic zf embryos expressing mH2A1:GFP-mH2A1.1 ( |
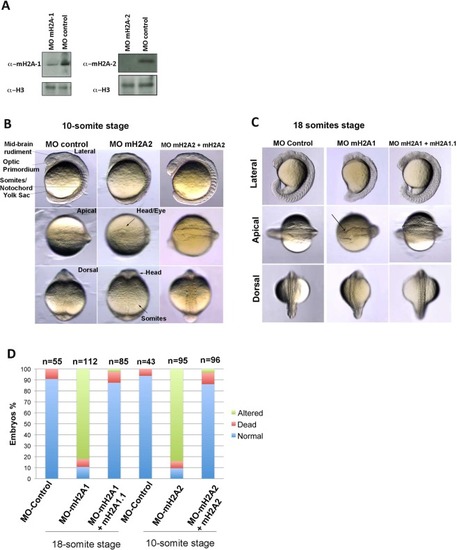
mH2A2 and mH2A1 are required for proper zebrafish embryo development. ( |