
- Title
-
Clostridium perfringens Epsilon Toxin Compromises the Blood-Brain Barrier in a Humanized Zebrafish Model
- Authors
- Adler, D., Linden, J.R., Shetty, S.V., Ma, Y., Bokori-Brown, M., Titball, R.W., Vartanian, T.
- Source
- Full text @ iScience

Figure 2. pETX Binds to hMAL-GFP Expressed in Zebrafish ISVs in a Time-Dependent Manner (A) Schematic depicting zebrafish transformation strategy, toxin injection site, and microscopic focus. Plasmids containing hMAL-GFP or hBENE-GFP were co-injected with tol2 transposase into the cell of 1-cell-stage zebrafish embryos. Positive fish 3–4 days post fertilization(DPF) were injected with Alexa 647-tagged pETX into the duct of Cuvier for systemic infection. The blue box indicates the region imaged in (B). (B) The 40× confocal z stack images of zebrafish ISVs in hMAL-GFP-expressing fish versus hBENE-GFP-expressing control fish. Scale bar, 25 μm. ISV, intersegmental blood vessel; DLAV, dorsal longitudinal anastomotic vessel. (C) Quantitative metric of co-localization, “Percent of ETX Material Co-localized in GFP Vessel,” indicates the percentage of pETX voxels co-localized in hMAL-GFP fish ISVs (n = 6 fish) versus hBENE-GFP control ISVs (n = 7 fish) above the automatically set threshold at 1 h post injection. Data are represented as mean ± SEM. Statistical analysis: unpaired, two-tailed Student's t test (**p < 0.01). (D) Equal volumes of GFP along the walls of ISVs were rendered into Imaris surfaces, and sum GFP and 647 intensities within the surface were tracked over the course of ∼90 min at 30-s intervals per fish. The ratio of 647-pETX/GFP was plotted over time for hMAL and hBENE transients. Individual ratios of every fish at each time point are represented by opaque circles, and the average ratio at each time point is represented by the darker line. (E) Snapshot images of 647-pETX or 647-H149A pETX and “merged” images with receptor at three time points post injection. Blue arrow highlights toxin accumulation. Scale bar, 20 μm. (F) Flow cytometry analysis of pETX or H149A pETX binding to hMAL, rMAL, or GFP CHO cells. See also Videos S1, S2, and S3. Statistical analysis: two-way ANOVA with Tukey’s test (∗∗∗∗p < 0.0001). |

Co-injection of Activated ETX and 2,000-kDa RhodamineDextran Reveals Pronounced BBB Leakage in hMAL-Expressing Fish (A) Schematic depicting experimental procedure. (B) The 40× confocal z stacks of the vasculature in the anterior dorsal quadrant of the brain in a representative hBENE-GFP transiently expressing control zebrafish. hBENE-GFP receptor is in green, the 2,000-kDa rhodamine dextran is in red, “merge” images show both channels, and “Merge Macro” images show full-brain neurovasculature. The blue box in “Merge Macro” highlights the area focused in for the other images; 15 min, 1 h, and 2 h indicate the time z stack imaging commenced after toxin or dextran injection. Scale bar, 50 μm in “Merge Macro” and 30 μm in the rest of the images. (C) Same as (B) but in an hMAL-GFP-expressing fish. (B′) Imaris “surface” rendering of hBENE-GFP in green and rhodamine dextran in red used for quantification of GFP sum intensity and total “intravascular” rhodamine sum intensity within the lumen of blood vessels at 2 h post injection. (C′) Same as (B′) but in hMAL-GFP fish. (D) Quantification of dextran leakage ascertained by determining extravascular dextran sum intensity divided by intravascular sum intensity (“dextran E/I”) at 15 min, 1 h, and 2 h post injection. Data included from experiment using hBENE-GFP fish injected with active ETX (n = 5), hMal-GFP fish injected with active ETX (n = 6), and hMal-GFP fish injected with mutant control H149A pETX (n = 4). Data are represented as mean ± SEM. Statistical analysis: two-way ANOVA with Tukey’s test (***p < 0.001, ****p < 0.0001). |

Within Individual hMAL-GFP-Expressing Fish, Dextran Leaks Markedly More in Volumes of the Brain Populated by Receptor-Expressing Vessels than in Areas Without Receptor Expression (A) Schematic of injection and imaging strategy. (B) Confocal z stack of a representative fish transiently expressing hMAL-GFP (green) injected with active toxin and 2,000-kDa rhodaminedextran (red) and an adjacent image of just the red dextran channel. Because of the chimeric nature of expression most fish only expressed receptor in discrete parts of the brain, and as depicted, often in half of the brain. White arrows indicate regions of evident leakage. Blue and orange boxes represent the brain quadrants quantified in (C). (C) Quantification of E/I ratio at 2 HPI between volumes of the brain that have high levels of dextran expression (blue) and those with little dextran expression (orange) for each fish in each condition: hBENE transients injected with active ETX (n = 5/side of brain), hMAL transients injected with active ETX (n = 6/side of brain), hMAL transients injected with H149A mutant pETX (n = 4/side of brain). Significant difference between these two sides of the brain are only seen in the hMAL + active ETX condition (two-way ANOVA with Tukey's test, p = 0.0008). Data are represented as mean ± SEM. |
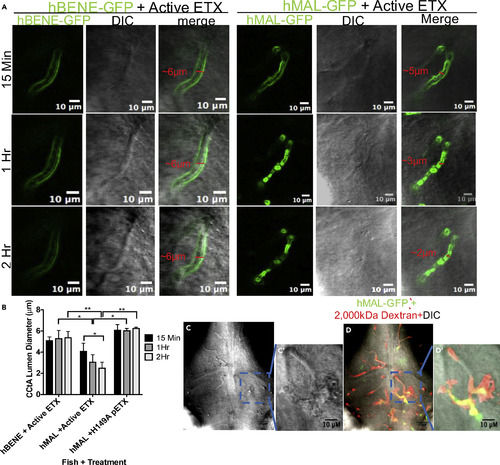
Active ETX Leads to Vessel Stenosis and Perivascular Edema (A) Zoomed-in confocal images of cerebral central arteries (CCtAs) in hBENE-GFP- and hMAL-GFP-expressing fish 15 min, 1 h, and 2 h post injection with active toxin. Green channels depict receptor expression in these vessels, gray channel depicts differential interference contrast images, “merge” overlays both images. Scale bar, 10 μm. (B) Quantitative comparison of CCtA vessel diameter over time for each condition; hMAL CCtA exposed to active ETX are significantly narrower than hBENE CCtAs exposed to ETX or hMAL CCtAs exposed to H149A mutant pETX starting at 1 HPI and showed significant decrease from 15 MPI to 2 HPI (two-way ANOVA with Tukey's test, *p < 0.05, **p < 0.01). Data are represented as mean ± SEM. (C) Confocal differential interference contrast macroscopic z-slice of zebrafish brain exhibiting perivascular edema in an hMAL-GFP-expressing fish and (C′) zoomed in single vessel. (D) Image (C) with merged hMAL-GFP and dextran channels and (D′) merged, zoomed-in single vessel. Scale bar, 25 μm for full image and 10 μm for zoomed-in vessel. |
ETX antibody neutralization eliminates dextran leakage and vascular pathology in hMALGFP expressing fish. Related to Figure 7. (A) 40X confocal images of hMAL-GFP expressing neurovasculature (green) co-injected with 2,000 kDa Dextran (red) and neutralized ETX at 15MPI, 1 HPI, and 2HPI. First three columns represent 3-D volumes depicted in “Merge Macro” blue box. Scale bars= 30µm in first three columns and 50µm in “Merge Macro” column. (B) Example of 2HPI Imaris 3-d rendering of hMAL-GFP and Dextran surfaces. (C) hMAL-GFP expression and DIC confocal imaging of CCtA vessel at the three time points. |

H149A mutant pETX fails to elicit dextran leakage or vascular pathology in hMAL-GFP expressing fish. Related to Figures 3 and 5. (A) 40X confocal images of hMAL-GFP expressing neurovasculature (green) co-injected with 2,000 kDa Dextran (red) and H149A pETX at 15MPI, 1 HPI, and 2HPI. First three columns represent 3-D volumes depicted in “Merge Macro” blue box. Scale bars= 30µm in first three columns and 50µm in “Merge Macro” column. (B) Example of 2HPI Imaris 3-D rendering of hMAL-GFP and Dextran surfaces. (C) hMAL-GFP expression and DIC confocal imaging of CCtA vessel at the three time points. |