FIGURE SUMMARY
Title

Dynamic super-resolution structured illumination imaging in the living brain

Authors
Turcotte, R., Liang, Y., Tanimoto, M., Zhang, Q., Li, Z., Koyama, M., Betzig, E., Ji, N.
Source
Full text @ Proc. Natl. Acad. Sci. USA

AO is essential for SIM imaging in brain tissue. (AD) Images of dendrites at a depth of 25 μm in a cortical slice of a Thy1-GFP line M mouse (A and B) without and (C and D) with AO. (Scale bars: 5 μm; Inset widths: A and C, 3 μm; B and D, 2 μm.) (E and F) Line profiles of (E) a spine head and (F) a spine neck with and without AO as identified by the lines in B and D. Images were normalized to the AO condition.

SIM yields spatial resolution superior to deconvolved widefield and TPEF microscopy both ex vivo and in vivo. (A–F) Images and corresponding OTFs of the same dendritic structure in a Thy1-GFP line M brain slice at a depth of 25 μm obtained with different imaging modalities, all with AO: (A and D) deconvolved widefield, (B and E) deconvolved TPEF, and (C and F) SIM. (Scale bar: 5 μm; Inset widths: 3 μm.) (G and H) Line profiles through a spine neck and a dendritic shaft, respectively. All deconvolutions were performed with Wiener filtering. (I–N) In vivo images of neurites in a larval zebrafish brain at a depth of 100 μm. Images of the same neurites obtained with (I and L) deconvolved widefield, (J and M) deconvolved TPEF, and (K and N) SIM with and without AO, respectively. Images were normalized independently. (Scale bar: 5 μm; Inset widths: 3 μm).

Strategies to combat motion-induced artifacts for in vivo SIM in the mouse brain. SIM images and OTFs reconstructed from raw data series (A) with one repetition and without raw image registration, (B) with one repetition and with registration, (C) with three repetitions and without registration, and (D) with three repetitions and with registration. Images were normalized independently. (Scale bar: 3 μm; Inset widths: 2.5 μm.)

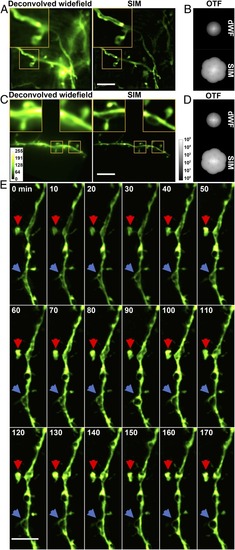
In vivo SR imaging of the mouse brain with AO SIM. (A) Deconvolved widefield (dWF) and SIM images of dendrites expressing ChR2-GFP, a membrane label. (Scale bar: 5 μm; Inset width: 5 μm.) (B) OTFs of the SIM and dWF images in A. (C) dWF and SIM images of neurons expressing cytosolic GFP (Thy-1 line M mouse). (Scale bar: 5 μm; Inset width: 3 μm.) (D) OTFs of the SIM and dWF images in C. (E) Time-lapse in vivo SIM images showing structural dynamics of a dendrite at a depth of 25 μm in the brain of a Thy1-GFP line M mouse after KCl injection. Arrows point to highly dynamic structures. Images were normalized independently. (Scale bar: 4 μm.)

Acknowledgments
This image is the copyrighted work of the attributed author or publisher, and ZFIN has permission only to display this image to its users. Additional permissions should be obtained from the applicable author or publisher of the image. Full text @ Proc. Natl. Acad. Sci. USA