
- Title
-
An FDA-Approved Drug Screen for Compounds Influencing Craniofacial Skeletal Development and Craniosynostosis
- Authors
- Seda, M., Geerlings, M., Lim, P., Jeyabalan-Srikaran, J., Cichon, A.C., Scambler, P.J., Beales, P.L., Hernandez-Hernandez, V., Stoker, A.W., Jenkins, D.
- Source
- Full text @ Mol. Syndromol.
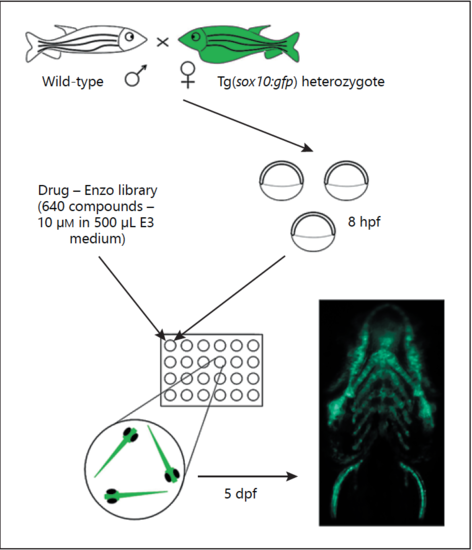
Overview of zebrafish drug screen employed in this study. Three embryos from a wild-type x sox10:gfp heterozygote cross per well were treated with one of 640 FDA-approved drugs in a 24-well plate format from 8 hours post-fertilisation (hpf) and screened for quantitative increases in the angle of the ceratohyoid cartilage or gross malformations at 5 days post-fertilisation (dpf). |
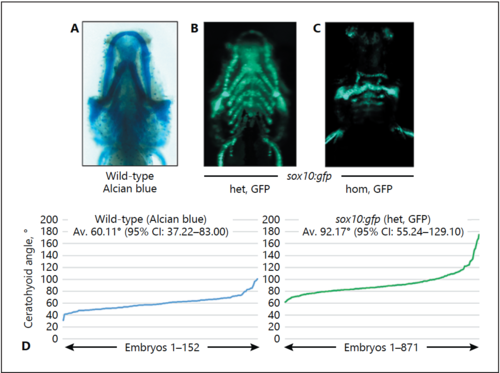
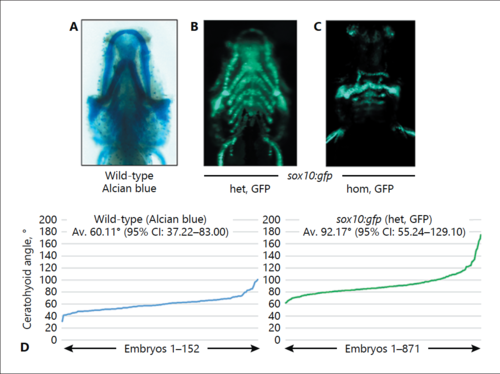
sox10:gfp transgenic embryos are sensitised for jaw patterning defects. A- C Ventral views of wild-type zebrafish (A) or fry that are heterozygous (B) or homozygous (C) for the sox10:gfp transgene. Note the gross structural abnormalities in homozygotes. D Angles between the ceratohyoid cartilages for each of the 152 wild-type zebrafish (left) and 871 heterozygous transgenics (right) at 5 days post-fertilization. Av, average; CI, confidence interval; GFP, green fluorescent protein; hom, homozygous; het, heterozygous. |
Drug screen results. A Examples of morphological phenotype categories identified in the screen, in comparison to normal control zebrafish. B Summary statistics of the number of drugs represented by each category in each of the 4 stages of screening/re-testing |
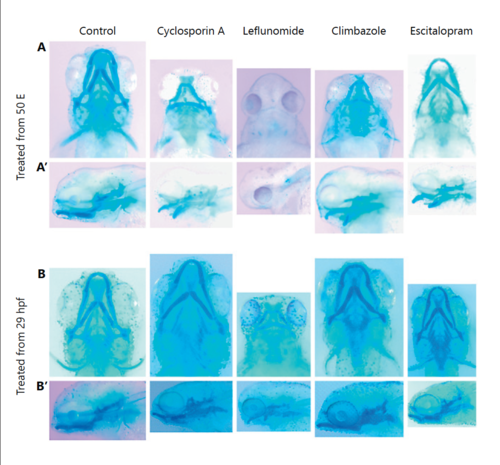
Examples of drug re-testing on wild-type zebrafish. Alcian blue-stained zebrafish at 5 days post-fertilisation showing jaw cartilage following drug treatment from embryonic day (E) 50 (A, A') or 29 hours post-fertilisation (hpf) (B, B'). A, B Ventral views. B, B' Lateral views of the same animals |

Dose-response of leflunomide treatment. Representative images in ventral view at 5 days post-fertilization showing effects of indicated doses of leflunomide treatment from 50% epiboly. |

Functional evaluation of DHODH inhibition. A Phenocopy of cartilage-loss phenotype following treatment with 10 µM teriflunomide between 50% epiboly to 5 days post-fertilization, and inhibition of sox10 expression at 24 hours post-fertilization following teriflunomide treatment, shown by in situ hybridisation. B Dose-dependent inhibition of cell numbers in SK-N-SH (n = 6), LAN5 (n = 3), and SK-N-AS (n = 5) cells after 3 days treatment with leflunomide. Data are from CCK8 assays with untreated controls given an arbitrary value of 1. All 100 μM samples are significantly different from untreated samples (p < 0.05). Furthermore, at 100 μM both SK-N-SH and LAN5 are significantly more sensitive than SK-N-AS (LAN5:SK-N-AS, p = 0.025; SK-N-SH:SK-N-AS, p = 0.002; ANOVA with post-hoc Scheffé test). Images show morphology of cells treated with 100 µM leflunomide for 3 days (note no increase in neurite formation, a differentiation marker). C Gene ontology terms statistically significantly enriched within the list of differentially expressed genes (log2-fold change >2, p < 0.05) according to DAVID software analysis. Number of terms within each category is listed. ****p < 5 × 10⁻⁵; ***p < 10-4; **p < 10-3; * p < 10-2; no asterisk, p < 0.05. |
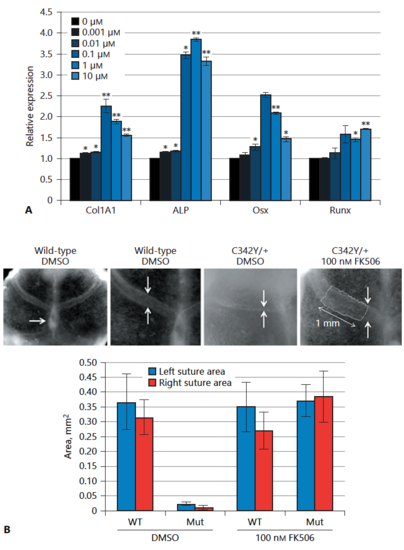
Functional assessment of calcineurin inhibition in skeletogenesis. A Relative expression of osteoblast differentiation marker genes normalised to untreated cells. * p < 0.05, **p < 0.005 (t test). B E18.5 calvarial explants cultured for 2 weeks in the presence or absence of 100 nMFK506. Top row: Low-power view of a control explant; note overlap of the midline parietal bones (arrows), showing continued osteogenesis of the sutures (1st and 2nd images). Whereas the DMSO-treated C342Y/+ coronal sutures undergo synostosis, FK506-treated C342Y/+ explants do not (arrows, 3rd and 4th images). The last image shows how the area of overlap of the frontal and parietal bones was measured over a fixed 1-mm length of suture (outlined) to gain a robust measure of suture width. These values are summarised over 33 explants, either wild-type (WT) or mutant (Mut), treated with DMSO or FK506. Values are given for both the left and right sutures for each explant. |