
- Title
-
Human Semaphorin 3 Variants Link Melanocortin Circuit Development and Energy Balance
- Authors
- van der Klaauw, A.A., Croizier, S., Mendes de Oliveira, E., Stadler, L.K.J., Park, S., Kong, Y., Banton, M.C., Tandon, P., Hendricks, A.E., Keogh, J.M., Riley, S.E., Papadia, S., Henning, E., Bounds, R., Bochukova, E.G., Mistry, V., O'Rahilly, S., Simerly, R.B., INTERVAL, UK10K Consortium, Minchin, J.E.N., Barroso, I., Jones, E.Y., Bouret, S.G., Farooqi, I.S.
- Source
- Full text @ Cell
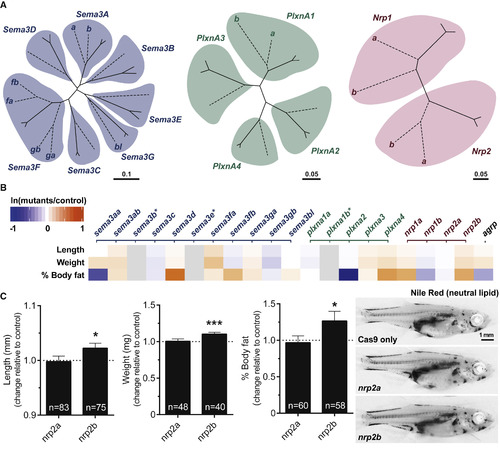
Disruption of Semaphorin 3 S, Neuropilins, and Plexins Alters Energy Homeostasis in Zebrafish (A) Unrooted phylogenetic trees of Sema3, PlxnA, and Nrp genes. Genes from zebrafish (dotted lines) and mouse and human (solid lines) were used to construct the trees. Where zebrafish genes have been duplicated, a letter is used to identify paralogs. Scale bars, number of substitutions per amino acid site. (B) Heatmap showing change in length, weight, and percentage of body fat in deletion mutants relative to Cas9-only control fish; decrease (blue), increase (orange) in the phenotype of mutants relative to control fish (for the natural log fold change); ∗genes not screened; agrp, positive control. (C) Length (mm), weight (mg) and percentage of body fat in nrp2a and nrp2bmutant fish relative to Cas9-only injected control fish. Data represented as mean ± SEM. ∗p < 0.05; ∗∗∗p < 0.001 in one-sample t tests. Representative images of Nile Red-stained zebrafish showing increased adiposity and size of nrp2b mutant fish (right). Scale bar, 1 mm.
PHENOTYPE:
|
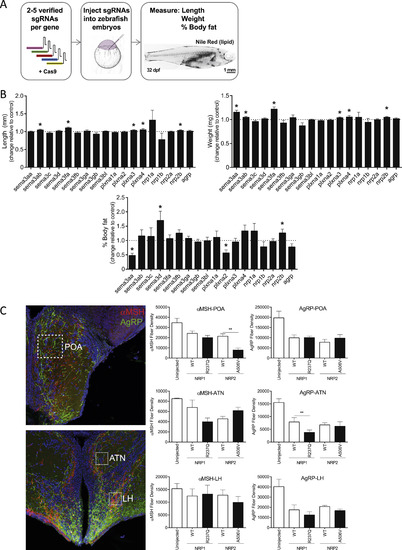
Generation and Characterization of Semaphorin-Neuropilin-Plexin Deletion Mutants in Zebrafish, Related to Figure 3 (A) Schematic illustrating the mutagenesis strategy to target sema3, plxna and nrpgenes in zebrafish. Two-five sgRNAs were generated to mutagenize each zebrafish gene. Only sgRNAs verified to induce mutagenesis were injected into one-cell stage zebrafish embryos. Zebrafish were raised to ∼30 days post fertilization and fish length (mm), weight (mg) and % body fat were quantified. (B) Results on fish length (mm), weight (mg) and % body fat for all deletion mutants (summarized in Figure 3B). (C) Microphotographs and quantification of the density of α-melanocyte-stimulating hormone (αMSH) (red) and agouti-related peptide (AgRP) (green) immunoreactive (IR) fibers innervating the preoptic area (POA), anterior tuberal nucleus of hypothalamus (ATN), and lateral hypothalamic nucleus (LH) of 35-day-old wild-type zebrafish overexpressing NRP1 and NRP2; ∗p < 0.05 in one-sample t tests. PHENOTYPE:
|
Reprinted from Cell, 176(4), van der Klaauw, A.A., Croizier, S., Mendes de Oliveira, E., Stadler, L.K.J., Park, S., Kong, Y., Banton, M.C., Tandon, P., Hendricks, A.E., Keogh, J.M., Riley, S.E., Papadia, S., Henning, E., Bounds, R., Bochukova, E.G., Mistry, V., O'Rahilly, S., Simerly, R.B., INTERVAL, UK10K Consortium, Minchin, J.E.N., Barroso, I., Jones, E.Y., Bouret, S.G., Farooqi, I.S., Human Semaphorin 3 Variants Link Melanocortin Circuit Development and Energy Balance, 729-742.e18, Copyright (2019) with permission from Elsevier. Full text @ Cell