
- Title
-
Ras-Induced miR-146a and 193a Target Jmjd6 to Regulate Melanoma Progression
- Authors
- Anelli, V., Ordas, A., Kneitz, S., Sagredo, L.M., Gourain, V., Schartl, M., Meijer, A.H., Mione, M.
- Source
- Full text @ Front Genet

miR-21, miR-146a/b, and miR-193a are upregulated by oncogenic RAS in transgenic cancer models. (A)Zebrafish models used in the study of Ras-dependent microRNAs. Green fluorescence denotes the expression of the eGFP-fused oncogene. In Kita:Ras GFP labels transformed melanocytes and notochord; in zic:Ras GFP marks ras-expressing brain cells; in HS-Ras, eGFP-Ras is expressed in whole embryos. For full description of transgenic lines, see text. (B) Diagram depicting the overlap between the three sets of upregulated microRNAs. (C) Taqman QPCR analysis of miR-21, miR-146a/b, and miR-193a expression levels in 3 dpf kita-RAS larvae compared to control (CT) larvae. The error bar represents the SEM of a triplicate experiment. (D) Heatmap representation of microarray analysis of miR-21, miR-146a/b, and miR-193a expression at different stages of melanoma progression. Distinct precursor sequences and genomic loci that express identical mature sequences are named on the form miR-21-1 and miR-21-2. Lettered suffixes denote closely related mature sequences. –5p and –3p indicate the 5′ and 3′ arm respectively. ∗P ≤ 0.05 and ∗∗P ≤ 0.01. EXPRESSION / LABELING:
PHENOTYPE:
|

ZFIN is incorporating published figure images and captions as part of an ongoing project. Figures from some publications have not yet been curated, or are not available for display because of copyright restrictions. EXPRESSION / LABELING:
PHENOTYPE:
|
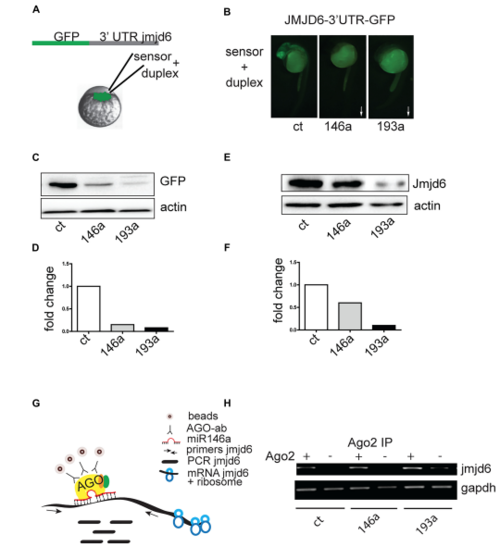
Jmjd6 is a target of miR-146a and miR-193a. (A) Effects of increasing microRNA levels on a Jmjd6-GFP sensor expression. Diagram of the construct used as sensor. (B) Representative images of 24 hpf zebrafish embryos injected with the Jmjd6-3′ UTR GFP sensor and the microRNA duplexes as indicated. Arrows illustrate the direction of the changes in expression. (C) Western blot analysis of GFP expression and (D) quantification of the changes in Jmjd6-3′ UTR GFP sensor levels upon microRNA overexpression. (E) Reduction of Jmjd6 protein levels following miR-146a, and miR-193a duplex injection in 3 dpf embryos shown by Western Blot analysis. (F)Quantification of the Western Blot shown in (E). (G) RIP (RNA immuno precipitation) diagram and (H) analysis of jmjd6 transcripts in the RISC complex following duplex injections in 3 dpf embryos. |
|
ZFIN is incorporating published figure images and captions as part of an ongoing project. Figures from some publications have not yet been curated, or are not available for display because of copyright restrictions. EXPRESSION / LABELING:
PHENOTYPE:
|
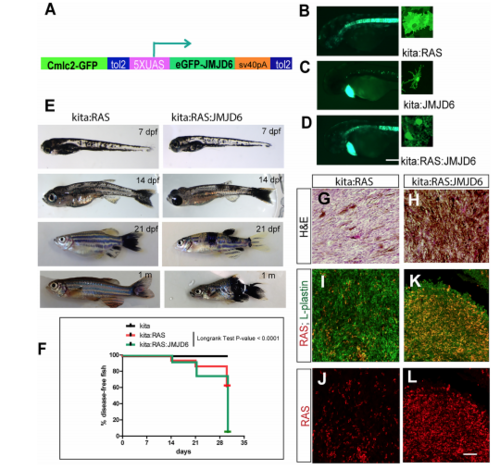
Expression of miR-resistant Jmjd6 promotes Ras-induced melanoma. (A) Schematic representation of the construct used to generate a transgenic line expressing microRNA-resistant Jmjd6 under the UAS promoter. Cmlc2-GFP is the cardiac myosin light chain promoter driving GFP expression in the heart as marker of transgenesis. (B–D) Examples of GFP staining in crosses between the UAS lines and the kita:Gal4 line (as indicated). Expression is visible in the notochord (Distel et al., 2009) and in melanocytes in all kita crosses (B–D), and in the heart for the UAS:Jmjd6 line, C,D) GFP is localized to the nucleus for Jmjd6-GFP or the plasma membrane for eGFP-HRASV12. (E) Double or triple transgenic larvae and juveniles at the indicated stages of development. (F) Disease- free survival curve of the double or triple transgenic fish. N = 100 for kita; 321 for kita:Ras; 211 for kita:Ras:Jmjd6. Long-rank test: p-value < 0,0001. (G,H) H&E staining of representative melanoma sections from transgenic fish as indicated. (I–L) Immunostaining for L-plastin (red florescence) and GFP (only in I–K, indicating HRASV12, green fluorescence) in representative melanoma sections from transgenic fish as indicated. Calibration bar: 100 μm for (B,D), 50 μm for (I–L). PHENOTYPE:
|
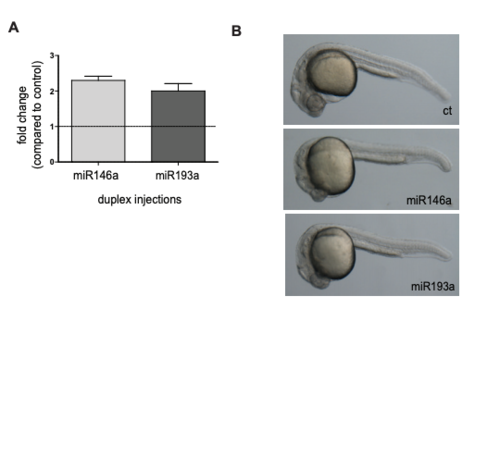
Injections of duplexes microRNAs cause increase of the corresponding microRNAs and mild developmental defects. (A) QPCR analysis of the expression levels of the microRNAs indicated. (B) All the other injected embryos developed without visible abnormalities.
|
|
ZFIN is incorporating published figure images and captions as part of an ongoing project. Figures from some publications have not yet been curated, or are not available for display because of copyright restrictions. EXPRESSION / LABELING:
PHENOTYPE:
|