
- Title
-
From mRNA Expression of Drug Disposition Genes to In Vivo Assessment of CYP-Mediated Biotransformation during Zebrafish Embryonic and Larval Development
- Authors
- Verbueken, E., Bars, C., Ball, J.S., Periz-Stanacev, J., Marei, W.F.A., Tochwin, A., Gabriëls, I.J., Michiels, E.D.G., Stinckens, E., Vergauwen, L., Knapen, D., Van Ginneken, C.J., Van Cruchten, S.J.
- Source
- Full text @ Int. J. Mol. Sci.

Localization of biotransformation of benzyloxy-methyl-resorufin (BOMR) in the trunk region of intact zebrafish embryos and larvae at 26 h post-fertilization (hpf) (b,c), 50 hpf (d,e), 74 hpf (f,g), 98 hpf (h,i), 122 hpf (j,k), 9 d post-fertilization (dpf) (l,m) and 14 dpf (n,o). At 7 hpf (a), qualitative analysis of resorufin formation was performed in the whole embryo. Pictures show one embryo/larva out of six used in the study, i.e., three biological replicates with two embryos/larvae per replicate, for each developmental stage. Figure 4a shows a vegetal pole view of the embryo. In Figure 4b–o lateral views of the anterior and posterior part of the trunk region are shown. The organs in which resorufin had been formed are indicated with a two-letter combination. Since the otic vesicle is part of the head region, resorufin formation in the respective organ is mentioned separately. S.B.: swim bladder. Scale bar: 200 µm; anterior left and dorsal top. |

Localization of biotransformation of 7-ethoxyresorufin (ER) in the trunk region of intact zebrafish embryos and larvae at 26 h post-fertilization (hpf) (b,c), 50 hpf (d,e), 74 hpf (f,g), 98 hpf (h,i), 122 hpf (j,k) and 14 d post-fertilization (dpf) (l,m). At 7 hpf (a), qualitative analysis of resorufin formation was performed in the whole embryo. The stage of 9 dpf was excluded from the figure since resorufin formation could not be localized due to ventral position of the larvae. Pictures show one embryo/larva out of six used in the study, i.e., three biological replicates with two embryos/larvae per replicate, for each developmental stage. Figure (a) shows a vegetal pole view of the embryo. In Figure 5 (b–m) lateral views of the anterior and posterior part of the trunk region are shown. The organs in which resorufin had been formed are indicated with a two-letter combination. Since the hatching gland and otic vesicle do not belong to the trunk region, resorufin formation in the respective organs is mentioned separately. S.B.: swim bladder. Scale bar: 200 µm; (b,c): anterior top and dorsal right; (d–m): anterior left and dorsal top. |
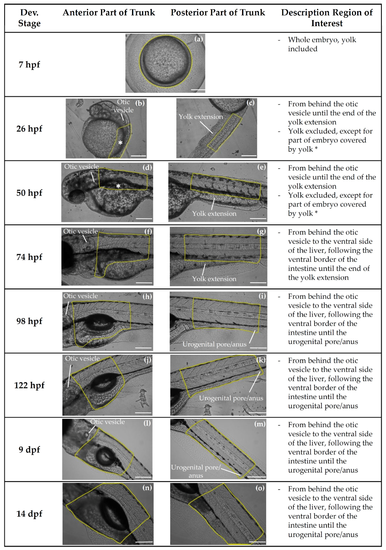
Description of region of interest used for the quantitative and qualitative analysis of resorufin formation in zebrafish embryos and larvae at 7 h post-fertilization (hpf) (a), 26 hpf (b,c), 50 hpf (d,e), 74 hpf (f,g), 98 hpf (h,i), 122 hpf (j,k), 9 d post-fertilization (dpf) (l,m) and 14 dpf (n,o) after exposure to benzyloxy-methyl-resorufin (BOMR) or 7-ethoxyresorufin (ER). The yellow frame indicates the region of interest in the embryo or larva. Since for most embryos/larvae the complete trunk region did not fit within one image, pictures of anterior and posterior trunk were taken separately. For the quantitative analysis of resorufin formation in each embryo/larva, average pixel intensities of anterior and posterior trunk images were combined. Figure 7 (a) shows a vegetal pole view of the embryo. In Figure 7 (b–o) lateral views of the anterior and posterior part of the trunk region are shown. Scale bar: 200 µm; (b,c): anterior top and dorsal right; (d–o): anterior left and dorsal top. |