
- Title
-
Regional Gene Expression Profile Comparison Reveals the Unique Transcriptome of the Optic Fissure
- Authors
- Cao, M., Ouyang, J., Liang, H., Guo, J., Lin, S., Yang, S., Xie, T., Chen, S.
- Source
- Full text @ Invest. Ophthalmol. Vis. Sci.
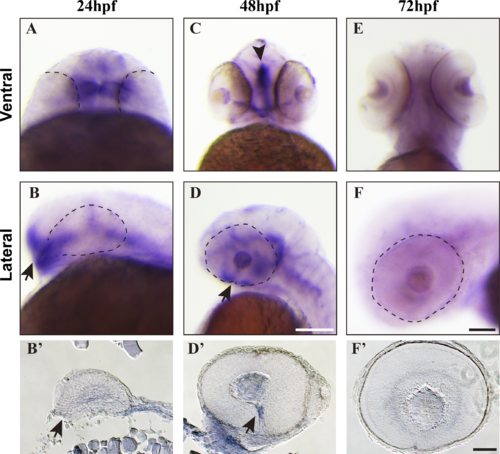
Zebrafish afap1l2 is specifically expressed at the closing OF. Whole-mount RNA ISH of afap1l2 in zebrafish embryos at 24 hpf (A, B, B'), 48 hpf (C, D, D'), and 72 hpf (E, F, F'). (A) A frontal view of a zebrafish head at 24 hpf. (C, E) Lateral views of zebrafish heads. (B, F) Ventral views of zebrafish heads. (B', F') Sagittal section images of zebrafish embryonic heads after afap1l2 whole-mount ISH. Arrows in (B, B', D, D') point to the OF. The arrowhead in (C) points to the midline signal of afap1l2. Scale bars are all 100 μm. The scale bar in (D) applies to (A–D); the scale bar in (F) applies to (E, F); and the scale bar in (F') applies to (B'–F'). |

afap1l2 is required for proper closure of the OF in zebrafish. (A) The diagram of partial zebrafish afap1l2 gene structure illustrates the targeting positions of MO1 and MO2 and the locations of primers for splicing variant RT-PCR. (B) MO1 knockdown efficacy reporter assay showing that coinjecting MO1 with the reporter plasmid blocked GFP expression. (C) MO2 knockdown efficiency RT-PCR assay showing that MO2 knockdown resulted in shorter amplicons lacking exon 4. (D) Eye images of control and afap1l2 morphants. Arrowheads point to the OF. (E) Quantification of percentage of coloboma incidences in afap1l2-morphant zebrafish shows that the penetrance of both afap1l2 MOs exhibited dosage dependency. (F) Quantification of incidences of coloboma phenotype of afap1l2 mRNA rescue experiments. mRNA (mu): mutant form of afap1l2 mRNA. Numbers at the bottom of each column in (E, F) denote the number of zebrafish used in each experimental group. PHENOTYPE:
|
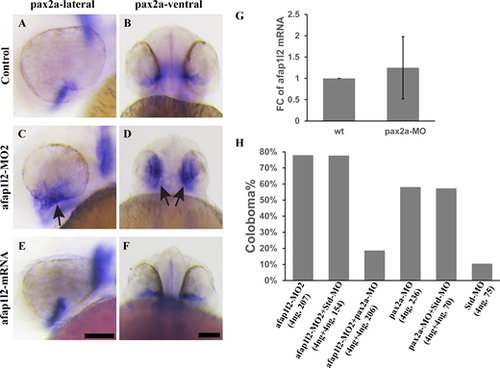
afap1l2 controls OF closure by regulating pax2a expression. (A–F) ISH of pax2a in the eyes of control, afap1l2-morphant, and afap1l2-overexpressing zebrafish at 36 hpf. (A, B) Lateral views; (C, D) ventral views. (G) qPCR comparison of afap1l2 expression levels in the eyes of wild-type and pax2a-morphant zebrafish. FC: fold change. (H) Quantification of incidences of coloboma phenotype of afap1l2-MO and pax2a-MO coinjection. Numbers in parentheses denote dosage of the morpholinos used and the number of zebrafish injected. The scale bars in (E, F) are both 100 μm, and they apply to (A, C, E) and to (B, D, F), respectively. EXPRESSION / LABELING:
PHENOTYPE:
|