
- Title
-
The Locus Coeruleus Modulates Intravenous General Anesthesia of Zebrafish via a Cooperative Mechanism
- Authors
- Du, W.J., Zhang, R.W., Li, J., Zhang, B.B., Peng, X.L., Cao, S., Yuan, J., Yuan, C.D., Yu, T., Du, J.L.
- Source
- Full text @ Cell Rep.

ZFIN is incorporating published figure images and captions as part of an ongoing project. Figures from some publications have not yet been curated, or are not available for display because of copyright restrictions. PHENOTYPE:
|
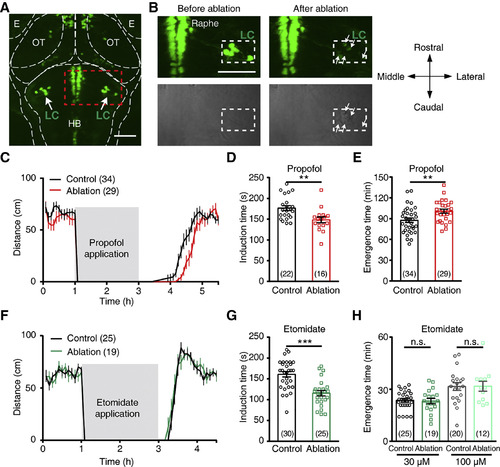
LC Neurons Are Important for Intravenous General Anesthesia (A) Confocal image showing the location of LC neurons in a 5 dpf ETvmat2:GFP larva. The dotted outlines indicate the borders of major brain regions. E, eye; HB, hindbrain; OT, optic tectum. Scale bar, 50 μm. (B) Enlarged images of the area outlined by a dashed square in (A), showing that after two-photon laser-based ablation, GFP-positive LC neurons on the right side of the brain (white rectangle) disappeared (top) and bulb-like structures appeared (bottom). As a control, the fluorescence intensity of dorsal raphe neurons was not obviously affected. Scale bar, 50 μm. (C) Spontaneous swimming distance of control (black) and LC-ablated (red) larvae before, during, and after treatment with 30 μM propofol. Each data point represents the total swimming distance for 5 min. Larvae at 6 dpf were used. (D and E) Induction (D) and emergence (E) times of anesthesia induced by 30 μM propofol for control and LC-ablated larvae. Each symbol indicates the data from a single larva. (F) Spontaneous swimming distance of control (black) and LC-ablated (red) larvae before, during, and after treatment with 30 μM etomidate. (G and H) Induction (G) and emergence (H) times of anesthesia induced by 30 or 100 μM (only for emergence) etomidate for control and LC-ablated larvae. n.s., not significant. ∗∗p < 0.01 and ∗∗∗p < 0.001 (unpaired Student’s t test). Data are represented as mean ± SEM. EXPRESSION / LABELING:
|
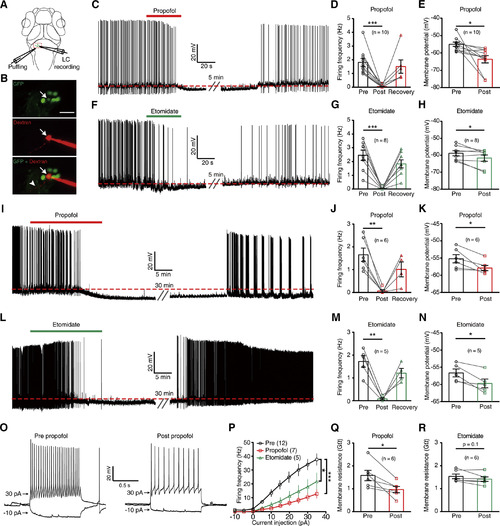
LC Neurons’ Excitability Is Suppressed by Intravenous Anesthetics (A) Schematic diagram showing whole-cell recording of LC neurons and simultaneous local puffing of anesthetic drugs onto the LC. (B) Confocal images showing the morphology of a recorded GFP-labeling LC neuron after loading Alexa Fluor 594 dextran into the cell (arrow) via the recording pipette in a 6 dpf ETvmat2:GFP larva. The arrowhead indicates the process of the recorded neuron. Scale bar, 20 μm. (C) Spontaneous spike firing of an LC neuron before and after puffing of propofol. The red dashed line indicates the mean resting membrane potential before propofol treatment. (D and E) Summary of data showing the effect of propofol treatment on the spontaneous spike frequency (D) and resting membrane potential (E) of LC neurons. Pre, before puffing; post, immediately after puffing; recovery, 10 min after puffing. (F) Spontaneous spike firing of an LC neuron before and after puffing of etomidate. (G and H) Summary of data showing the effect of etomidate treatment on the spontaneous spike frequency (G) and resting membrane potential (H) of LC neurons. (I–N) Effects of bath application of 30 μM propofol (I–K) or 30 μM etomidate (L–N) on spontaneous activities of LC neurons. (O) Representative traces showing LC neurons’ voltage responses evoked by current injections before (left) and immediately after (right) puffing of propofol. (P) Summary of data showing the effect of propofol (red) or etomidate (green) on current injection-evoked spike firing of LC neurons. (Q and R) Summary of data showing the effect of propofol (Q) or etomidate (R) on the membrane resistance of LC neurons. Numbers of cells examined are in parentheses. The two-tailed paired Student’s t test was performed for the data in (D), (E), (G), (H), (J), (K), (M), (N), (Q), and (R) and Kolmogorov-Smirnov test for the data in (P). n.s., not significant. ∗p < 0.05, ∗∗p < 0.01, and ∗∗∗p < 0.001. |
|
ZFIN is incorporating published figure images and captions as part of an ongoing project. Figures from some publications have not yet been curated, or are not available for display because of copyright restrictions. PHENOTYPE:
|
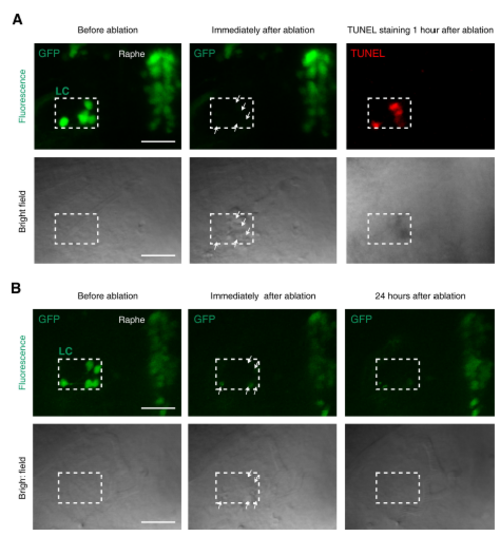
Confirmation of LC neuron death induced by two-photon laser-based ablation, Related to Figure 2. (A) TUNEL signals in the ablated LC area in an ETvmat2:GFP larva. TUNEL staining was performed 1 hour after two-photon ablation. Top, fluorescent images showing GFP or TUNEL signal; bottom, bright field images showing bulb-like structures (white arrows). All images were obtained from the same larva. Scale: 50 μm. (B) No GFP-positive cells in the ablated LC area in an ETvmat2:GFP larva 24 hours after two-photon ablation. Top, fluorescent images showing GFP signal; bottom, bright field images showing bulb-like structures (white arrows). All images were obtained from the same larva. Scale: 50 μm. |

Effects of off-target ablation on intravenous general anesthesia, Related to Figure 2. (A) Confocal image showing GFP expression in the brain of a 5-dpf Tg(HuC:GFP) larva. The dotted outlines indicate the borders of major brain regions. E, eye; HB, hindbrain; OT, optic tectum. Scale: 50 μm. (B) Enlarged images of the area outlined by a dashed red square in (A), showing that, after off-target ablation of neurons which were dorsal-lateral to the LC area at both the left and right hindbrain, GFP signals in the ablation sites disappeared (top, white arrows) and bulb-like structures appeared (bottom, white arrows). Scale: 50 μm. (C) Spontaneous swimming distance of control (black) and off-target ablated larvae (red) before, during and after the treatment of 30 μM propofol. Each data point represents the total swimming distance for 5 min. Larvae at 6 dpf were used. (D and E) Induction (D) and emergence time (E) of anesthesia induced by 30 μM propofol for control (black) and off-target ablated larvae (red). Each symbol represents the data from a single larva. (F) Spontaneous swimming distance of control (black) and off-target ablated larvae (greed) before, during and after the treatment of 30 μM etomidate. Each data point represents the total swimming distance for 5 min. Larvae at 6 dpf were used. (G and H) Induction (G) and emergence time (H) of anesthesia induced by 30 μM etomidate for control (black) and off-target ablated larvae (green). Each symbol represents the data from a single larva. The number in the brackets indicates the number of larvae examined. The unpaired student’s t-test was performed for statistical analysis. n.s., not significant. Data are represented as mean ± SEM. |