
- Title
-
Ensheathing cells utilize dynamic tiling of neuronal somas in development and injury as early as neuronal differentiation
- Authors
- Nichols, E.L., Green, L.A., Smith, C.J.
- Source
- Full text @ Neural Dev.

Sensory neurons become ensheathed shortly after neuronal differentiation. (a). Confocal z-projection frame of a Tg(sox10:mcherry); Tg(ngn1:gfp) zebrafish DRG at 72 hpf showing complete ensheathment. (b). Diagram of sensory neuron cell soma ensheathment by satellite glia. (c). Diagram of Eos photoconversion paradigm before neuronal differentiation. (d). Confocal z-projection images from a 24-h timelapse starting at 48 hpf of a Tg(sox10:eos) zebrafish with a photoconverted DRG neuron showing ensheathment of neuronal cell soma. White arrows denote dynamic projections of the ensheathing cell circumnavigating the neuron soma. (e). Confocal three-dimensional images of a nascent Tg(sox10:eos) DRG with a photoconverted neuron before and after ensheathment. D denotes dorsal, M denotes medial, V denotes ventral, and L denotes lateral. (f). Plot of two ensheathing processes converging on the same area of the of the neuron. (0,0) represents the site of the convergence of ensheathing processes. Red circle denotes the location of the neuron cell soma. (g). Intensity profiles transecting two approaching ensheathing processes every 75 min. (h). Deconvolved confocal z-projection images of two approaching ensheathing projections represented in (g). White brackets denote the gap between the two ensheathing processes. White arrows denote the emergence of the cellular processes. (i, j). Graphs of the areas of neurons (i) and ensheathing cells (j) before and after neuronal soma ensheathment (n = 5 DRG). (i, j) use a paired Student’s t-test. Scale bar is 10 μm (a, d, e, h). All intensity measurements were taken from sum z-projections |

Ensheathing cells remodel during neurite outgrowth. (a). Confocal z-projection images from a 24-h timelapse starting at 48 hpf of Tg(ngn1:gfp), Tg(sox10:eos) zebrafish with photoconverted ensheathing cells. White arrowheads denote the extending axon. White arrows denote glial horns. (b). Graph of the distance between the two dorsally located ensheathing projections (red) and the length of the extending axon (green). Shaded blue box denotes the period of axon initiation (n = 12 DRG). (c-f). Graphs of the circularity (c), aspect ratio (d), roundness (e), and solidity (f) of the ensheathing glia before, during, and after axon initiation (n = 12 DRG). (g). Confocal images of a Tg(ngn1:gfp), Tg(sox10:eos) DRG before, during, and after axonal initiation showing glial horn formation. Dashed red and green lines denote the transecting lines used for the intensity profiles in (h-j). (h-j). Intensity profiles of Tg(ngn1:gfp) expression (green) and photoconverted Tg(sox10:eos) expression (red) through the dorsal apex of the DRG neuron before (h), during (i), and after (j) axon initiation. The line x = 0 represents the center of the neuron. (k-m). Histogram of the location of the Tg(ngn1:gfp) (green) and photoconverted Tg(sox10:eos) (red) intensity peaks before (k), during (l), and after (m) axon initiation (n = 12 DRG). X = 0 represents the center of the neuron. (c-f) use a Tukey’s honest significant difference (HSD) test. Scale bar is 10 μm (a, g) |
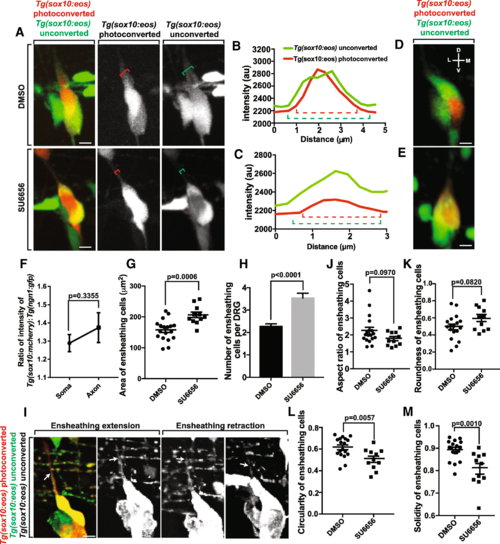
Neuronal cell soma ensheathment is distinct from axonal ensheathment. (a). Confocal z-projection images of a Tg(sox10:eos) zebrafish with a photoconverted neuron at 72 hpf. The top images were taken of an animal treated with DMSO. The bottom images were taken from an animal treated with SU6656. Red bracket denotes the width of the axon. Green bracket denotes the width of the ensheathing cells. (b, c). Intensity profiles of Tg(sox10:eos) unconverted (green) and Tg(sox10:eos) converted (red) transecting the axon from animals treated with DMSO (b) and SU6656 (c). Dashed red bracket denotes the width of the axon. Dashed green bracket denotes the width of the ensheathing cell. (d, e). Confocal three-dimensional images of a Tg(sox10:eos) DRG with a photoconverted neuron in DMSO and SU6656 treated animals. D denotes dorsal, M denotes medial, V denotes ventral, and L denotes lateral. (f). Ratio of the width of Tg(sox10:mcherry); Tg(ngn1:gfp) peaks taken from intensity profiles transecting the neuronal soma and axon (n = 10 DRG). (g) Area of the ensheathing cells in DMSO and SU6656 treated animals (n = 18 DMSO DRG, n = 11 SU6656 DRG). (h). Number of ensheathing cells per DRG at 72 hpf (n = 18 DMSO DRG, n = 11 SU6656 DRG). (i). Deconvolved confocal z-projections of a Tg(sox10:eos) DRG with a photoconverted neuron in a SU6656-treated animal. White arrow denotes the dorsal tip of an ensheathing cell on the DRG axon. (j-m). Graphs of the aspect ratio (j), roundness (k), circularity (l) and solidity (m) of the ensheathing cells before, during, and after axon initiation (n = 18 DMSO DRG, n = 11 SU6656 DRG). (g, h, j-m) use an unpaired Student’s t-test. (f) uses a paired Student’s t-test. Scale bar is 10 μm (a, d, e, i). All intensity measurements were taken from sum z-projections |

Cells ensheathing DRG neuron cell somas exhibit space filling throughout life. (a). Confocal z-projection images from a 24-h timelapse starting at 72 hpf of a Tg(sox10:eos); Tg(ngn1:gfp) with photoconverted ensheathing cells. White arrowhead and arrows denotes areas of neuronal soma that are re-ensheathed. (b). Intensity profiles transecting two approaching ensheathing processes every 30 min. (c). Confocal z-projection images from a 24-h timelapse starting at 48 hpf of a Tg(sox10:eos) zebrafish with a laser ablation of an ensheathing cell. White arrows denote the migrating ensheathing process. (d). Confocal 3D images of a Tg(sox10:eos) DRG with a photoconverted neuron and an ablated ensheathing cell at 0 and 24 hpi. D denotes dorsal, M denotes medial, V denotes ventral, and L denotes lateral. (e). Percent of DRG neurons that are ensheathed 24 hpi (n = 14 unablated DRG, n = 10 ablated DRG). (f). Histogram of the time after ablation that re-ensheathment of the neuron soma is completed (n = 5 DRG). Scale bar is 10 μm (a, c, d) |
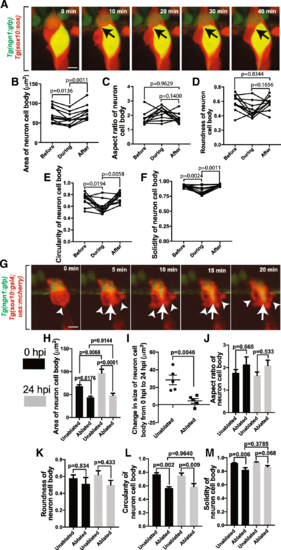
Perturbation of ensheathment impacts DRG neuron shape. (a). Confocal z-projection images from a 24-h timelapse starting at 72 hpf of a Tg(ngn1:gfp), Tg(sox10:eos) zebrafish with photoconverted sox10+ cells. Black arrows denote change in neuronal shape. (B-F). Graphs of area (b), aspect ratio (c), roundness (d), circularity (e), and solidity (f) of the neuron soma before, during, and after the division of an ensheathing cell (n = 11 neurons). (g). Confocal z-projection images from a 24-h timelapse starting at 48 hpf of a Tg(ngn1:gfp), Tg(sox10:gal4; uas:mcherry) zebrafish with photoconverted sox10+ cells and with an ablated ensheathing cell. White arrowheads denote responding ensheathing cells. White arrows denote the change in neuronal shape. (h). Area of the neuronal soma of DRG with ablated and unablated ensheathing cells at 0 hpi (black) and 24 hpi (gray) (n = 5 unablated DRG, n = 5 ablated DRG). (i). Change in the area of the neuronal soma in ablated and unablated DRG from 0 hpi and 24 hpi (n = 5 unablated DRG, n = 5 ablated DRG). (j-m). Graphs of the aspect ratio (j), roundness (k), circularity (l), and solidity (m) of the neuronal soma in ablated and unablated DRG at 0 hpi (black) and 24 hpi (gray) (n = 5 unablated DRG, n = 5 ablated DRG). (b-f) use a paired Tukey’s HSD test. (h,j-m) use an unpaired Tukey’s HSD test. (i) uses an unpaired Student’s t-test, Scale bar is 10 μm (a, g) |

Extended perturbations of soma-ensheathing cells results in misplaced neurons. (a). Confocal z-projection images from a 24-h timelapse starting at 48 hpf of a Tg(foxd3:mcherry) zebrafish. White arrows denote the center of the neuronal soma. (b). Confocal z-projection images from a 24-h timelapse starting at 72 hpf of a Tg(sox10:eos) zebrafish with a laser ablation of multiple ensheathing cells. White arrows denote the original location of the dorsal apex of the DRG neuron. (c). Change in the y-position over time of a neuron in an ablated and unablated DRG. Y = 0 denotes the final location of the neuronal soma. (d). Total distance traveled by the DRG neuronal soma in an ablated and unablated DRG (n = 5 neurons). (e). Confocal z-projection images from a 24-h timelapse starting at 48 hpf of a Tg(sox10:eos) zebrafish with a photoconverted neuron and ablated ensheathing cell. White arrows denote the migration of the nascent axon. (d) use an unpaired Student’s t-test. Scale bar is 10 μm (a, b, e) |
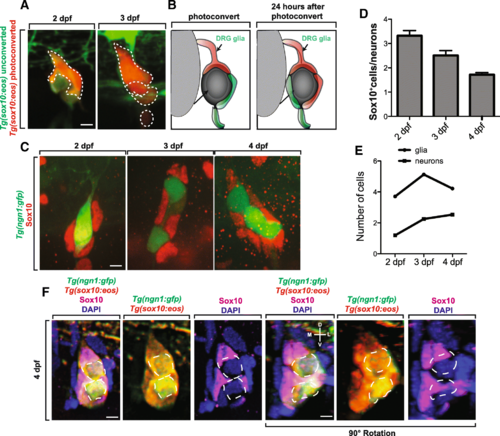
Proliferation of ensheathing cells is correlated with DRG sensory neuron expansion. (a). Confocal z-projection images of a Tg(sox10:eos) zebrafish with a single ensheathing cell photoconverted at 2 dpf. Images were taken at 2 and 3 dpf. Dashed outlines denote Tg(sox10:eos) photoconverted+ cells. (b). Schematic summary of the use of photoconversion in the proliferation of ensheathing cells. (c). Confocal z-projection images of Tg(ngn1:gfp) zebrafish stained with Sox10 at 2–4 dpf. (d). Ratio of the number Sox10+ cells to the number of neurons in a DRG at 2–4 dpf (n = 16 DRG). (e). Number of Sox10+ cells and neurons present in the DRG at 2–4 dpf (n = 16 DRG). (f). Confocal z-projection images of a Tg(ngn1:gfp); Tg(sox10:eos) 4 dpf zebrafish with photoconverted Eos and stained with Sox10 and DAPI. Bottom row is rotated 90°. Dashed outlines denote neuronal somas. D denotes dorsal, L denotes lateral, V denotes ventral, and M denotes medial. Scale bar is 10 μm (a, c, f) |

Ensheathing cells respond to peripheral neuronal injury. (a). Confocal z-projection image of a Tg(sox10:eos) zebrafish with a DRG with a peripheral lesion and an adjacent non-lesion DRG. White box denotes site of lesion. (b). Confocal z-projection image of a 24-h timelapse starting at 72 hpf in a Tg(sox10:eos) zebrafish. Top images denote a non-lesion DRG, and bottom images denote a DRG with a peripheral lesion. White arrows denote the movement of ensheathing cells. (c). Intensity profile of lesioned and non-lesioned peripheral axons. (d). Time elapsed after lesion for rearrangement of ensheathing cells in lesioned and non-lesioned DRG (n = 5 lesion DRG, n = 5 non-lesion DRG). (e-f). Plots of ensheathing cells following axonal lesion on non-lesioned (e) and lesioned (f) neurons. Shaded gray areas denote location of the neuron. (0,0) denotes the center of the peripheral axon. (g). Average velocity of ensheathing cells following injury on lesioned and non-lesioned neurons (n = 5 lesion DRG, n = 5 non-lesion DRG). (h). Schematic compass of DRG neuron into quadrants. D denotes dorsal, P denotes posterior, V denotes ventral, A denotes anterior. (i). Percentage of responding cells that originate in each quadrant of the neuron (n = 5 DRG). (j). Schematic compass of DRG neuron by anatomical descriptor. D denotes dorsal, P denotes posterior, V denotes ventral, A denotes anterior. (k). Percentage of responding cells that stabilize in each portion of the neuron (n = 5 DRG). (g) uses an unpaired Student’s t-test. Scale bar is 10 μm (a, b) |