
|
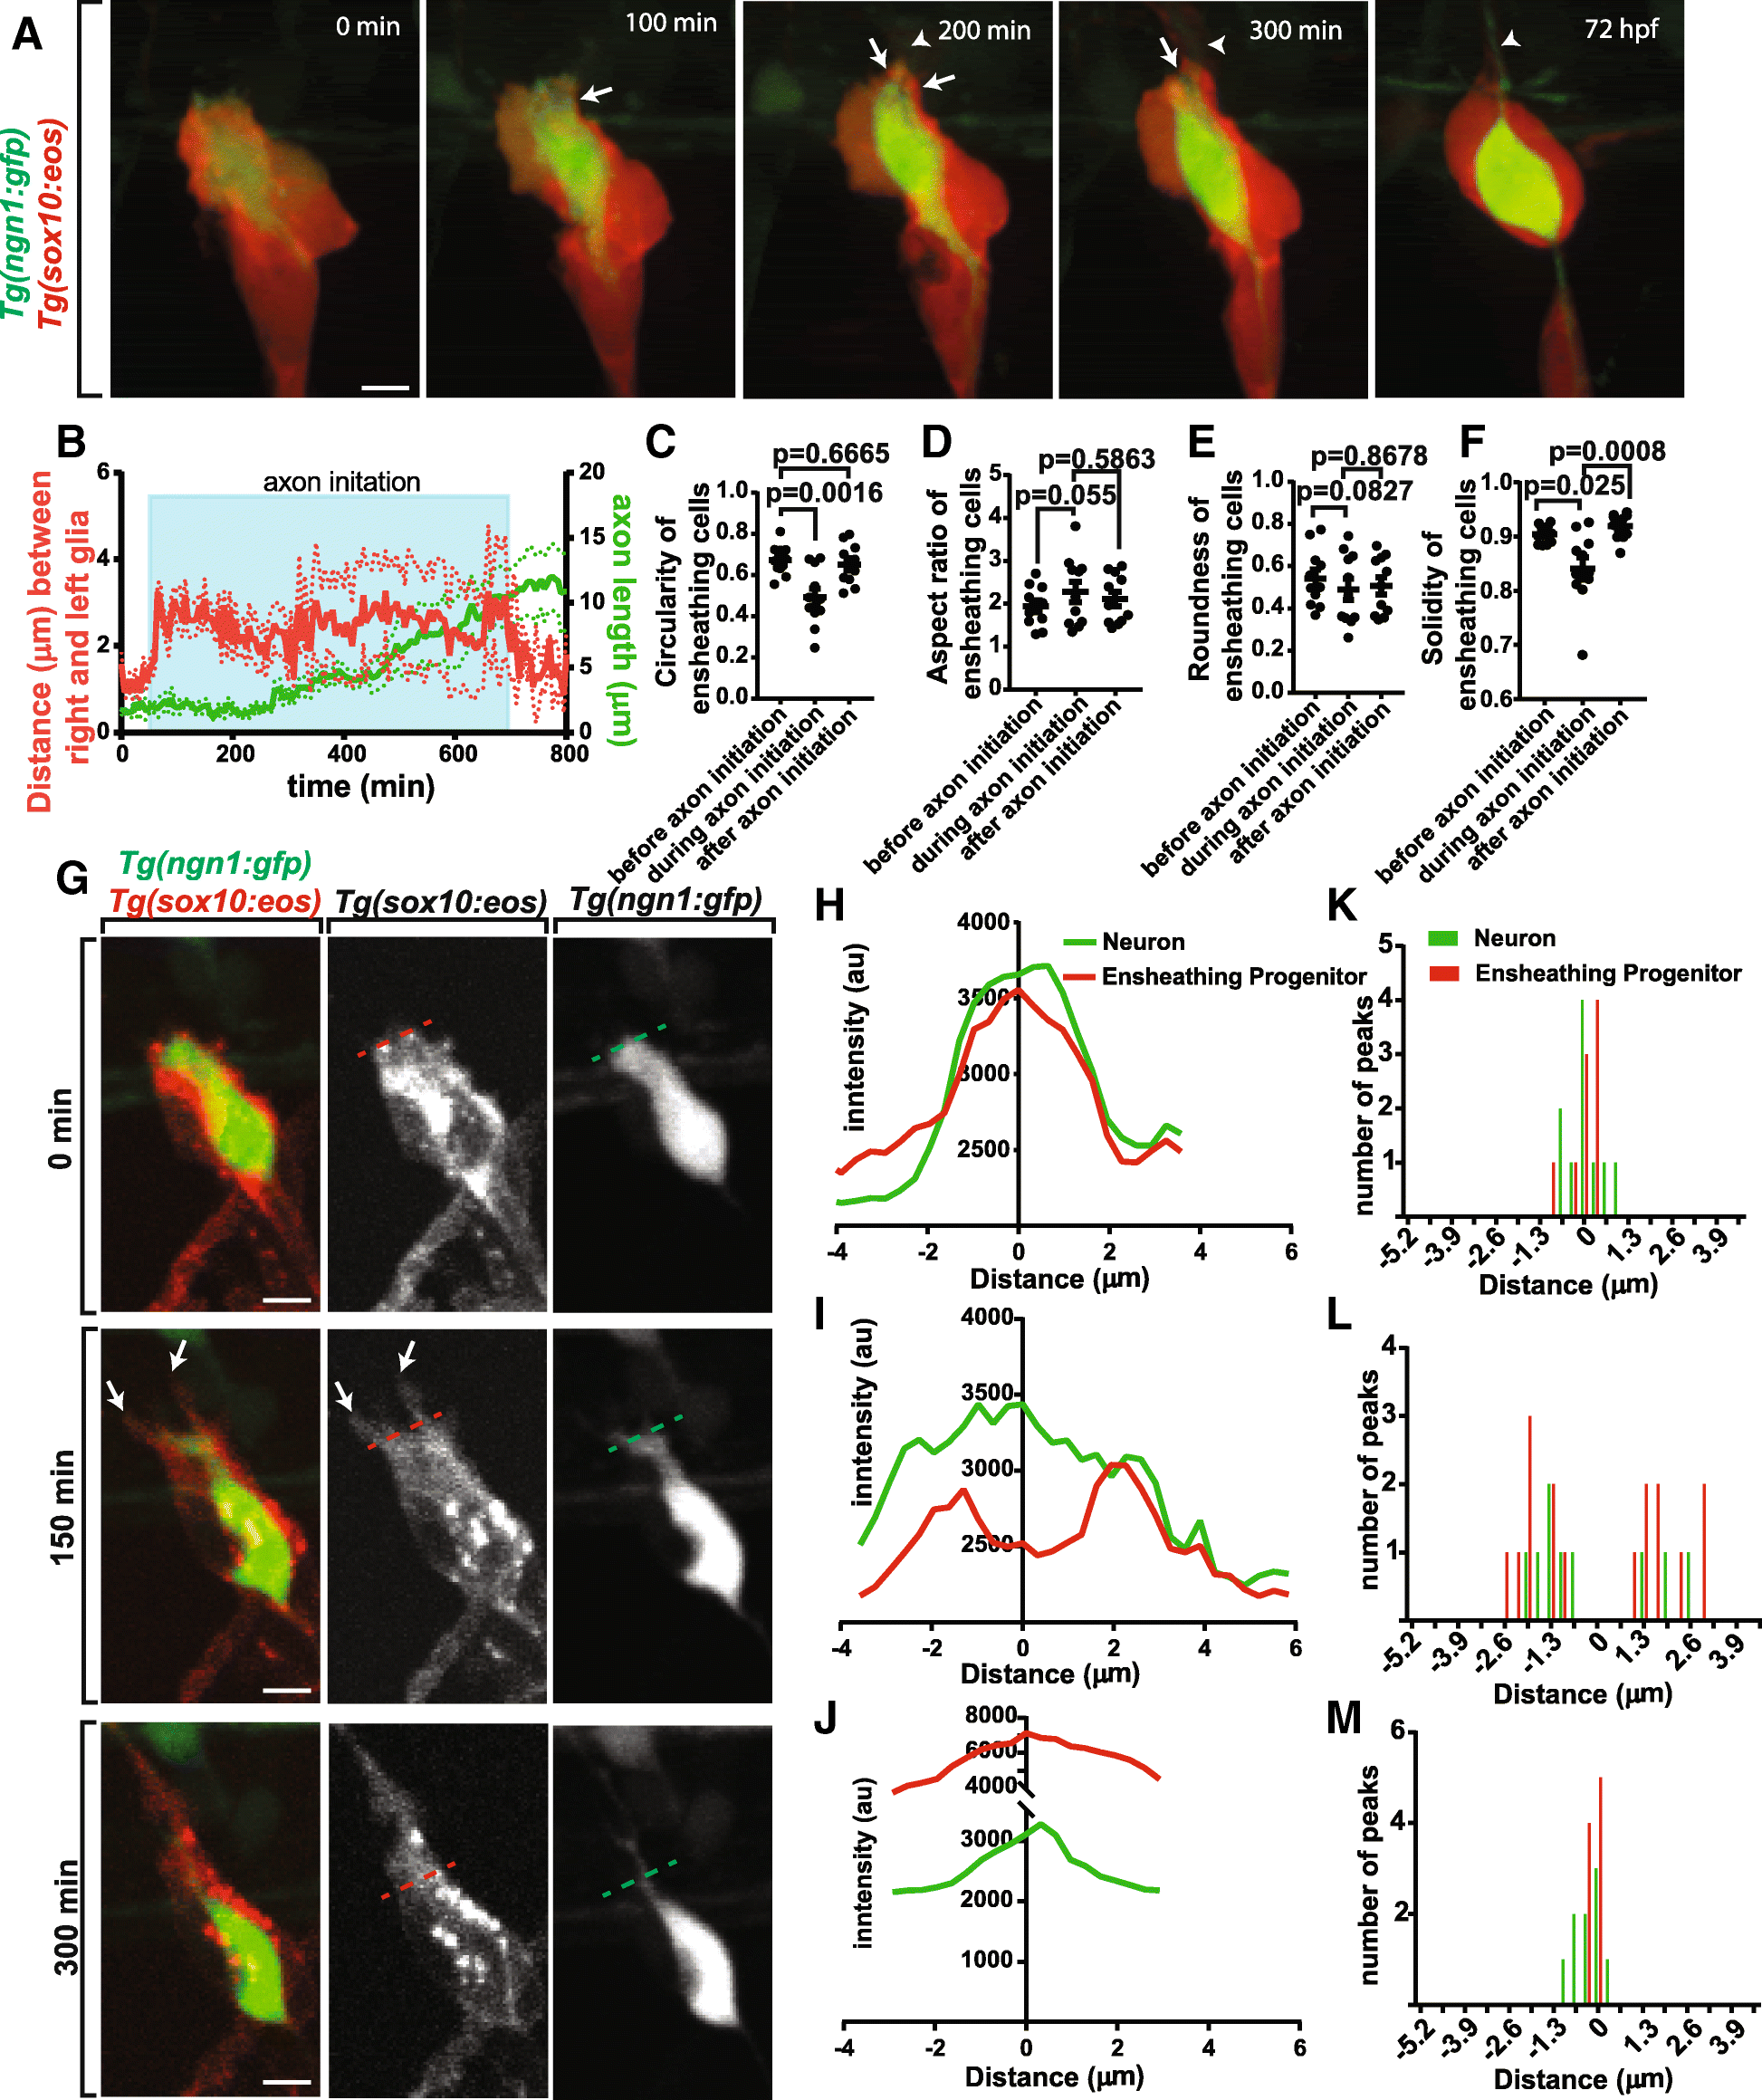
Fig. 2
Ensheathing cells remodel during neurite outgrowth. (a). Confocal z-projection images from a 24-h timelapse starting at 48 hpf of Tg(ngn1:gfp), Tg(sox10:eos) zebrafish with photoconverted ensheathing cells. White arrowheads denote the extending axon. White arrows denote glial horns. (b). Graph of the distance between the two dorsally located ensheathing projections (red) and the length of the extending axon (green). Shaded blue box denotes the period of axon initiation (n = 12 DRG). (c-f). Graphs of the circularity (c), aspect ratio (d), roundness (e), and solidity (f) of the ensheathing glia before, during, and after axon initiation (n = 12 DRG). (g). Confocal images of a Tg(ngn1:gfp), Tg(sox10:eos) DRG before, during, and after axonal initiation showing glial horn formation. Dashed red and green lines denote the transecting lines used for the intensity profiles in (h-j). (h-j). Intensity profiles of Tg(ngn1:gfp) expression (green) and photoconverted Tg(sox10:eos) expression (red) through the dorsal apex of the DRG neuron before (h), during (i), and after (j) axon initiation. The line x = 0 represents the center of the neuron. (k-m). Histogram of the location of the Tg(ngn1:gfp) (green) and photoconverted Tg(sox10:eos) (red) intensity peaks before (k), during (l), and after (m) axon initiation (n = 12 DRG). X = 0 represents the center of the neuron. (c-f) use a Tukey’s honest significant difference (HSD) test. Scale bar is 10 μm (a, g)