
- Title
-
Motor neuron development in zebrafish is altered by brief (5-hr) exposures to THC (∆9-tetrahydrocannabinol) or CBD (cannabidiol) during gastrulation.
- Authors
- Ahmed, K.T., Amin, M.R., Shah, P., Ali, D.W.
- Source
- Full text @ Sci. Rep.
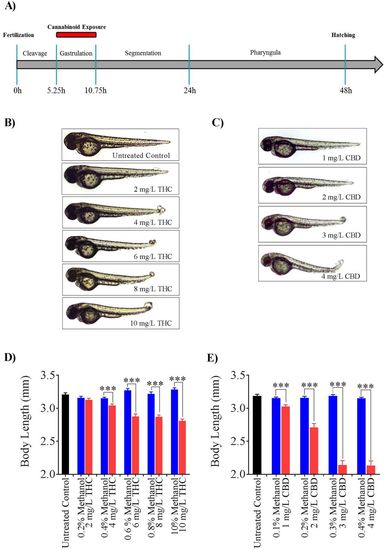
Effect of THC and CBD exposure on zebrafish embryos. (A) A schematic of the exposure paradigm of cannabinoids in this study. Red bar shows the duration of the cannabinoid exposure which occurred for 5 hours during gastrulation. (B,C) Embryos were untreated (control), or exposed to 2 mg/L, 4 mg/L, 6 mg/L, 8 mg/L or 10 mg/L THC or 1 mg/L, 2 mg/L, 3 mg/L or 4 mg/L CBD (from 5.25 hpf to 10.75 hpf and then allowed to develop in normal embryo media. Images were taken at 48–52 hpf. (D) Bar graph showing the body lengths of fish in untreated control (black, n = 59), different concentrations of THC (pink, n = 54, 48, 61, 57 and 55 for 2, 4, 6, 8 and 10 mg/L THC-treated fish respectively) or corresponding vehicle control (blue, n = 39, 37, 22, 25 and 20 for 0.2, 0.4, 0.6, 0.8 and 1 percent methanol-treated fish respectively). (E) Bar graph showing the body lengths of fish in untreated control (black, n = 51), different concentrations of CBD (pink, n = 52, 52, 25 and 19 for 1, 2, 3 and 4 mg/L CBD-treated fish respectively) or corresponding vehicle control (blue, n = 36, 39, 32 and 37for 0.1, 0.2, 0.3, and 0.4 percent methanol-treated fish respectively). ***Significantly different from vehicle control, p < 0.001. |
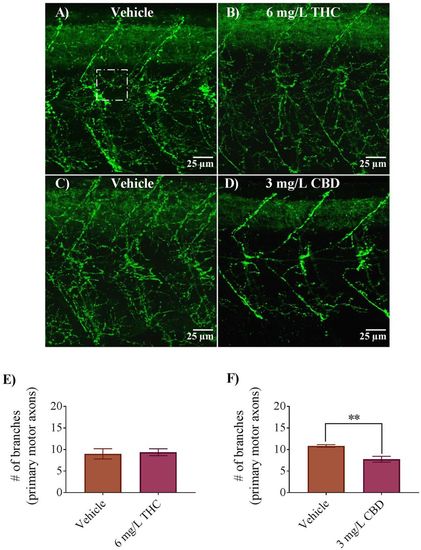
Antibody labelling (anti-znp1) of axonal branches of primary motor neurons in 2 dpf embryos in vehicle controls, 6 mg/L THC-treated embryos and 3 mg/L CBD treated embryos. (A–D) Branching patterns and labelling of axons appear to be similar between controls and THC-treated embryos but reduced in CBD treated embryos. (E) Bar graph showing the number of branches emanating from primary motor axons in vehicle control (n = 7) and 6 mg/L THC treated embryos (n = 8), counted from 9 different square areas (each 1500 μm2 area). (F) Bar graph showing the number of branches emanating from primary motor axons in vehicle control (n = 6) and 3 mg/L CBD treated embryos (n = 8), counted from 9 different square areas (each about 1500 μm2 area). *Significantly different from vehicle control, p < 0.01. |
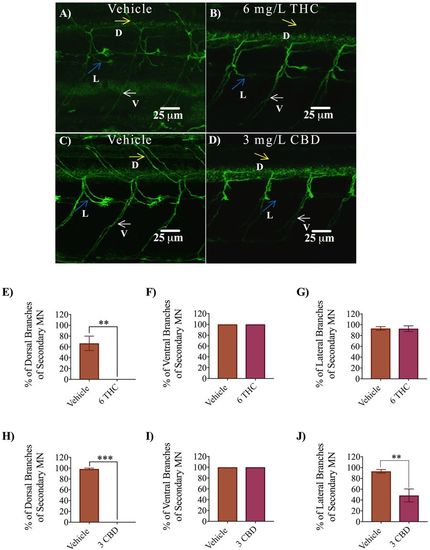
Antibody labelling (anti-zn8) of axonal branches of secondary motor neurons in 2 dpf embryos in vehicle control, 6 mg/L THC-treated embryos and 3 mg/L CBD treated embryos. (A–D) Dorsal, ventral and lateral branches emanating from secondary motor neurons are indicated by yellow, white and blue arrows. Dorsal branches were absent in THC and CBD treated embryos (B,D). Fewer lateral branches are visible in CBD treated embryos. (E–G) Bar graph comparing percentage of dorsal branches (E), ventral branches (F) and lateral branches (G) emanating from secondary motor neurons in vehicle control (n = 11) and 6 mg/L THC treated embryos (n = 11). (H–J) Bar graph comparing percentage of dorsal branches (H), ventral branches (I) and lateral branches (J) emanating from secondary motor neurons in vehicle control (n = 11) and 3 mg/L CBD treated embryos (n = 9). **Significantly different from vehicle control, p < 0.01. ***Significantly different from vehicle control, p < 0.001. |
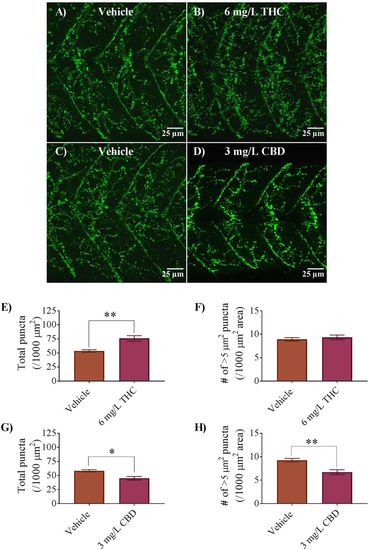
Expression of nicotinic acetylcholine receptors (nAChRs) in 2 dpf embryos of controls, 6 mg/L THC and 3 mg/L CBD-treated fish. (A–D) α-bungarotoxin labelling of postsynaptic membranes at the NMJ in zebrafish trunk musculature. (E) Bar graph representing the total number of α-bungarotoxin puncta counted over per 1000 μm2 area and compared between vehicle control (n = 10) and 6 mg/L THC-treated embryos (n = 6). (F) Bar graph representing the number of α-bungarotoxin puncta with a minimum area of ~5 μm2, compared between vehicle control (n = 10) and 6 mg/L THC-treated embryos (n = 6). (G) Bar graph representing the total number of α-bungarotoxin puncta counted over a 1000 μm2 area and compared between vehicle control (n = 8) and 3 mg/L CBD-treated embryos (n = 7). (H) Bar graph representing the number of α-bungarotoxin puncta with a minimum area of ~5 μm2, compared between vehicle control (n = 8) and 3 mg/L CBD-treated embryos (n = 7). * Significantly different from vehicle controls, p < 0.05. **Significantly different from vehicle controls, p < 0.01. |
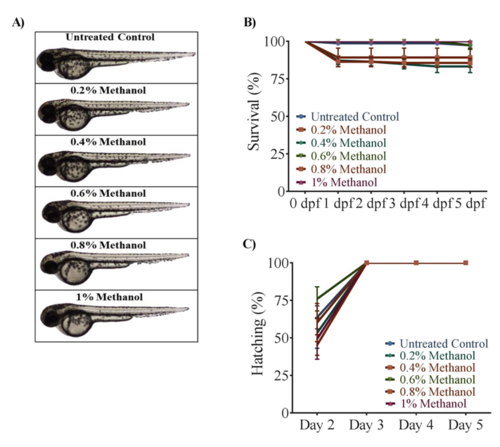
Effect of vehicle control of THC (methanol) on morphology, survival and hatching of zebrafish embryos. (A) Embryos were untreated (control), or exposed to 0.2%, 0.4%, 0.6%, 0.8% or 1% methanol (from 5.25 hpf to 10.75 hpf) and then allowed to develop in normal embryo media. Images were taken at 48-52 hpf. (B) Line graph showing the percentage of embryos that survived within the first 5 days of development following methanol exposure during gastrulation (N=5 experiments and n=125 embryos for each treatment). (C) Line graph showing the percentage of embryos that hatched within the first 5 days after egg fertilization following methanol exposure (N=3-5 experiment and n=75-125 embryos for each treatment). |

Effect of vehicle control of CBD (methanol) on morphology, survival and hatching of zebrafish embryos. (A) Embryos were exposed to 0.1%, 0.2%, 0.3% or 0.4% methanol (from 5.25 hpf to 10.75 hpf) and then allowed to develop in normal embryo media. Images were taken at 48-52 hpf. (B) Line graph showing the percentage of embryos that survived within the first 5 days of development following methanol exposure during gastrulation (N=5 experiments and n=125 for each treatment). (C) Line graph showing the percentage of embryos that hatched within the first 5 days after egg fertilization following methanol exposure (N=5 experiments and n=125 embryos for each treatment). |