
|
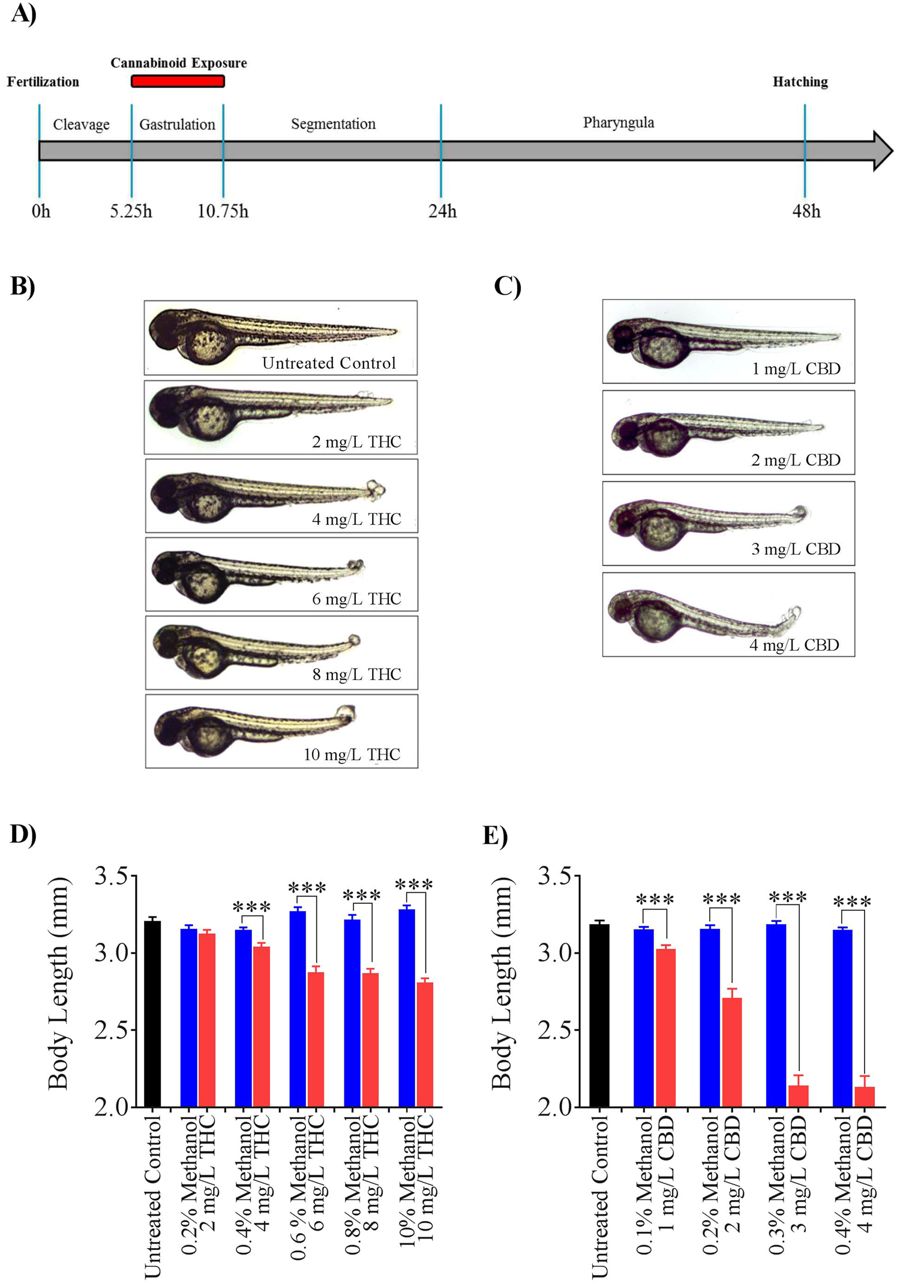
Fig. 1
Effect of THC and CBD exposure on zebrafish embryos. (A) A schematic of the exposure paradigm of cannabinoids in this study. Red bar shows the duration of the cannabinoid exposure which occurred for 5 hours during gastrulation. (B,C) Embryos were untreated (control), or exposed to 2 mg/L, 4 mg/L, 6 mg/L, 8 mg/L or 10 mg/L THC or 1 mg/L, 2 mg/L, 3 mg/L or 4 mg/L CBD (from 5.25 hpf to 10.75 hpf and then allowed to develop in normal embryo media. Images were taken at 48–52 hpf. (D) Bar graph showing the body lengths of fish in untreated control (black, n = 59), different concentrations of THC (pink, n = 54, 48, 61, 57 and 55 for 2, 4, 6, 8 and 10 mg/L THC-treated fish respectively) or corresponding vehicle control (blue, n = 39, 37, 22, 25 and 20 for 0.2, 0.4, 0.6, 0.8 and 1 percent methanol-treated fish respectively). (E) Bar graph showing the body lengths of fish in untreated control (black, n = 51), different concentrations of CBD (pink, n = 52, 52, 25 and 19 for 1, 2, 3 and 4 mg/L CBD-treated fish respectively) or corresponding vehicle control (blue, n = 36, 39, 32 and 37for 0.1, 0.2, 0.3, and 0.4 percent methanol-treated fish respectively). ***Significantly different from vehicle control, p < 0.001.