
- Title
-
Volume EM Reconstruction of Spinal Cord Reveals Wiring Specificity in Speed-Related Motor Circuits
- Authors
- Svara, F.N., Kornfeld, J., Denk, W., Bollmann, J.H.
- Source
- Full text @ Cell Rep.
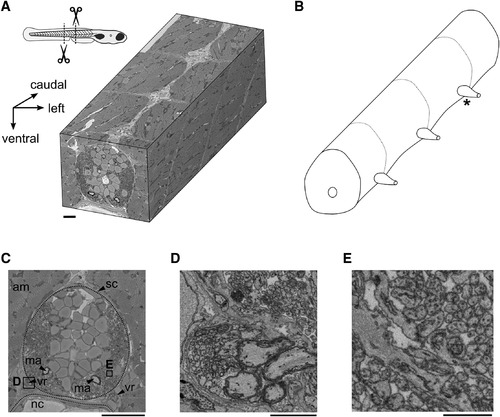
SBEM Volume of Zebrafish Spinal Cord (A) Three-dimensional EM volume comprising two complete segments from central spinal cord and two partial, adjacent segments. Schematic larval zebrafish shows the location of tissue sampling. (B) Schematic of spinal cord volume contained in the dataset. Dashed lines indicate approximate extent of spinal cord segments. Asterisk indicates the level of the pair of ventral roots from which MNs were reconstructed. (C) Transversal overview. am, axial musculature; ma, Mauthner axon; nc, notochord; sc, spinal cord; vr, ventral root. (D) Four large myelinated axons and many smaller unmyelinated axons exiting through a ventral root. Area as indicated in (C). (E) Densely packed neurites in the lateral neuropil. Area as indicated in (C). Scale bars: (C) 20 μm, (D) 2 μm, and (E) 1 μm. |
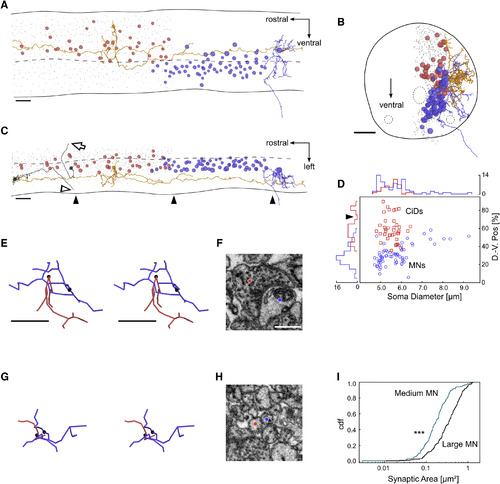
Reconstruction of CiD Interneurons (A–C) Sagittal (A), axial (B), and coronal (C) projections showing one LMN (blue) and one CiD in the rostrally adjacent segment (orange), both with skeletonized neurites. Also shown are the some locations of all reconstructed MNs on the left side of the spinal cord and of all reconstructed CiDs in the rostrally adjacent segment (blue and red disks, respectively). The diameters of the disks are equal to 40% of the actual soma diameters. Gray dots, all other soma locations in the region where CiDs were reconstructed. In addition, (C) shows two neurons (gray soma disks) for which tracing was aborted once it was determined that the cell could not be a CiD, because the axon crossed the midplane (open arrow) or passed through the VR (open arrowhead), respectively. (D) Dorsoventral position versus soma diameter for CiDs (red squares) and MNs (blue circles). Top and left: histograms. Arrowhead points at gap between displaced and non-displaced CiDs (compare Figures 5A and 5D). (E–H) Stereo-views of proximity location between a CiD axon (red) and an MN dendrite (blue), with (E) and without (G) an actual synapse. (F and H) corresponding cross-sections through EM data. Black spheres in (E) and (G) correspond to colored disks in (F) and (H). (I) Distribution of individual synaptic contact areas between CiDs and MNs for large (black line) and medium (blue-gray line) MNs (p < 0.001, Student’s t test). Scale bars: (A)–(C) 10 μm, (E) 1 μm, and (F) 500 nm. Scale bars in (E) and (F) also apply to (G) and (H). |