
- Title
-
50 Hz volumetric functional imaging with continuously adjustable depth of focus
- Authors
- Lu, R., Tanimoto, M., Koyama, M., Ji, N.
- Source
- Full text @ Biomed. Opt. Express
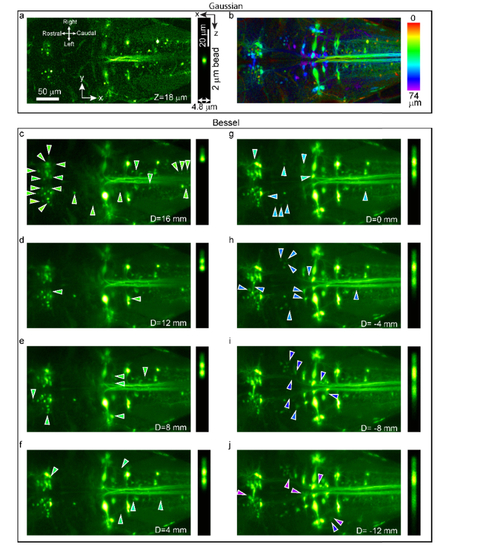
Scanning Bessel foci with variable axial lengths probes varying volumes of spinal projection neurons in vivo. Reticulospinal and vestibulospinal neurons labeled with Alexa Fluor 488 in a larval zebrafish were imaged by scanning either (a,b) Gaussian or (c-j) Bessel foci. Left panels: neuron images; Right panels: axial profiles of 2-μm-diameter beads. (a) An image acquired using Gaussian focus at the relative depth of 18 μm (114 μm from the surface) contains 38 neurons. (b) Mean intensity projection over 74 μm axial range (absolute depth from 96 μm to 170 μm), color-coded by relative depths. (c-j) Volumetric images acquired by scanning Bessel foci with different axial lengths. Longer foci revealed more structures, e.g., (c) 65 neurons; (g): 87 neurons and (j): 108 neurons. Arrowheads (same color code as in b) in each image point to example new structures (neurons or axons) compared to the previous image. Axicon 1 and Mask 1 were employed here. |
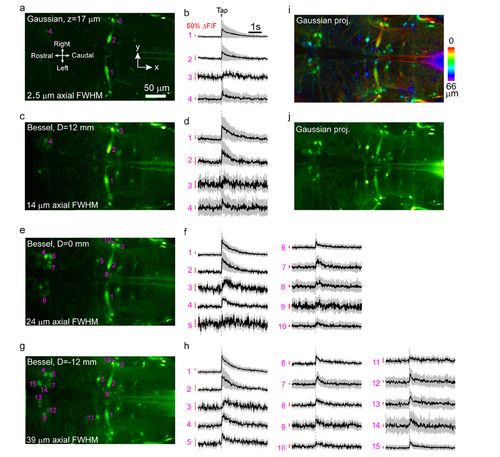
50 Hz volumetric functional calcium imaging of volumes of spinal projection neurons in zebrafish larvae. (a) Image acquired by Gaussian focus scanning at 127 μm from the dorsal surface of the head (relative depth z = 17 μm). (b) Averaged calcium transients of neurons evoked by the acoustomechanical tapping stimuli. (c), (e), and (g) were volumetric images obtained by scanning a short (14 μm axial FWHM), medium (24 μm axial FWHM), and long (39 μm axial FWHM) Bessel foci, respectively. (d), (f), and (h) were averaged calcium transients of responsive neurons. An acoustomechanical stimulus was delivered at 0 s. The Gaussian focus had 2.6 μm axial FWHM. The short (displacement of lens L2 D = 12 mm), medium (D = 0 mm) and long Bessel (D = −12 mm) foci has 14 μm, 24 μm and 39 μm axial FWHMs. The field of view was 366 μm × 214 μm. (See Visualization 2 for the functional movies.) (i) and (j) Mean intensity projections of a 66-μm-thick image stack acquired by Gaussian focus scanning (see Visualization 3 for the Gaussian 3D stack). Color in (i) encodes relative depth. Eleven trials were averaged in (b), (d), (f), and (h). Shadow represents standard deviations. Post-objective power: (a) 38 mW, (c) 97 mW, (e) 110 mW and (g) 132 mW. |