
- Title
-
The RNA-binding protein Celf1 post-transcriptionally regulates p27Kip1 and Dnase2b to control fiber cell nuclear degradation in lens development
- Authors
- Siddam, A.D., Gautier-Courteille, C., Perez-Campos, L., Anand, D., Kakrana, A., Dang, C.A., Legagneux, V., Méreau, A., Viet, J., Gross, J.M., Paillard, L., Lachke, S.A.
- Source
- Full text @ PLoS Genet.
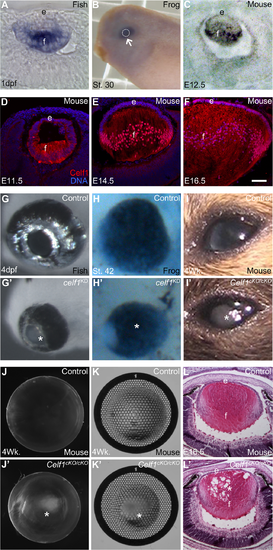
Celf1 is required for vertebrate lens development. (A) In zebrafish, celf1 transcripts are detected in the lens at 1 day post fertilization (1dpf) by in situ hybridization (ISH). (B) In X. laevis, ISH indicates strong celf1 expression (arrow) in the embryonic St. 30 eye (arrow) and lens (indicated by broken line area). (C) In mouse, ISH shows strong Celf1 transcript expression in the lens at embryonic day 12.5. (D) In mouse lens, Celf1 protein is expressed at (D) E11.5 (E) E14.5 and (F) E16.5 predominantly in fiber cells (f) and to a lower extent in epithelial cells (e). (G, G’) In zebrafish, while control eyes are normal, celf1 knockdown (KD) results in microphthalmia and clouding of lens (asterisk) by 4dpf. (H, H’) In X. laevis, compared to control, celf1 KD results in microphthalmia. (I, I’) In mouse, compared to control, Celf1cKO/cKO lens exhibits severe cataract (asterisk). (J-K’) Compared to control, refraction errors (asterisk) are observed in Celf1cKO/cKO lens under dark-field and light-field microscopy. (L, L’) At E16.5 stage, the mouse Celf1cKO/cKO lens exhibits abnormal spaces (asterisk) in the fiber cell region. Scale bar in F is 75 μm. |
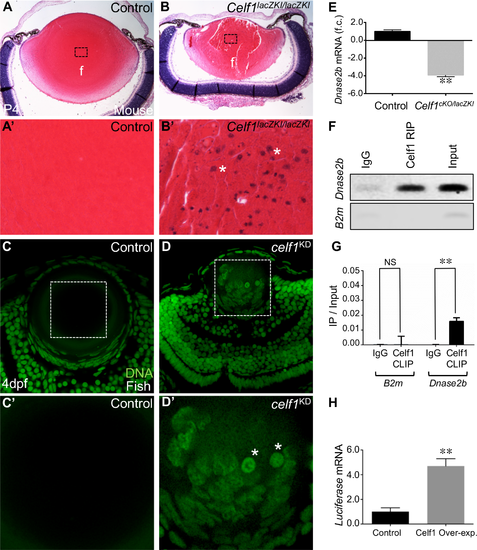
Celf1 deficiency in mouse and fish causes fiber cell nuclear degradation defects. (A, B) Histological analysis of control and Celf1lacZKI/lacZKI mouse lenses at post natal day 4 (P4) stage shows abnormal presence of nuclei in centrally located fiber cells only in Celf1lacZKI/lacZKI mice. (A’, B’) High-magnification of the dotted-line area in A, B. Asterisk denote abnormally retained nuclei. (C, D) In zebrafish, compared to control, celf1KD lens exhibit abnormal presence of nuclei in the central fiber cell region. (C’, D’) High-magnification of the dotted-line area in E, F. Asterisk denote abnormally retained nuclei. (E) RT-qPCR analysis confirms significant Dnase2b down-regulation in Celf1cKO/lacZKI lenses compared to control. (F) RNA immunoprecipitation (RIP) and (G) cross-linked RNA immunoprecipitation (CLIP) shows Dnase2b to be enriched in Celf1-pulldown in wild-type mouse lens. (H) Celf1 over-expression in NIH3T3 cells, which carry Dnase2b 3’UTR downstream of a luciferase reporter, results in significant increase of luciferase mRNA. Abbr.: f.c., fold-change; NS, not significant. Asterisks in E, G, H indicate a p-value < 0.005. PHENOTYPE:
|
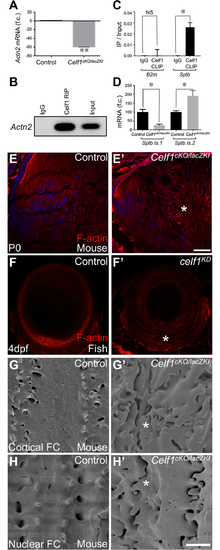
Celf1 deficiency in mouse and fish causes defects in fiber cell morphology. (A) RT-qPCR analysis confirms significant Actn2 down-regulation in Celf1cKO/lacZKI lenses compared to control. (B) RNA immunoprecipitation (RIP) identifies Actn2 as an enriched transcript in Celf1-pulldown in P15 wild-type mouse lens. (C) Cross-linked RNA immunoprecipitation (CLIP) shows Sptb transcripts to be enriched in Celf1-pulldown in wild-type mouse lens. (D) RT-qPCR analysis shows that the high-abundant Sptb isoform (isoform 1 (ENSMUST00000021458)) is reduced, while the low-abundant Sptb isoform (isoform 2 (ENSMUST00000166101)) is abnormally elevated in Celf1cKO/lacZKI lenses. (E, E’) In mouse, phalloidin staining of lens tissue sections (stage P0) shows uniform F-actin deposition along the fiber cell margins in control, while Celf1cKO/lacZKI lenses exhibit abnormal pattern of F-actin (asterisk). (F, F’) In zebrafish, while control lens exhibits normal F-actin deposition, celf1KD lens (stage 4dpf) exhibits abnormal F-actin pattern (asterisk) in fiber cells. (G-H’) In mouse, scanning electron microscopy analysis of cortical and nuclear fiber cells shows disrupted cell organization (asterisk) in Celf1cKO/lacZKI lenses (stage P15). Scale bar in D’ is 75 μm and G’ is 2.5μM. PHENOTYPE:
|
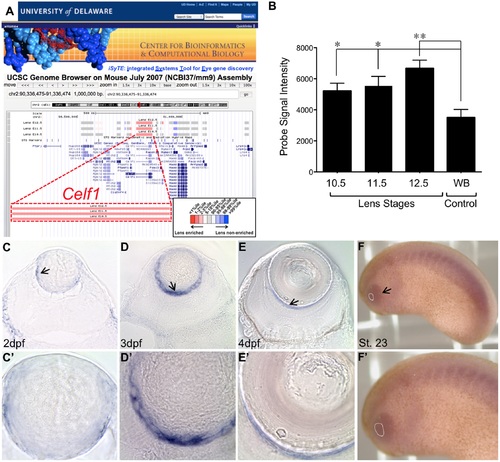
Celf1 mRNA expression in vertebrate lens development. (A)iSyTE identifies Celf1 as a highly lens-enriched gene in lens development. Lens enrichment extent is indicated by differing red color intensities in the heat-map. (B) Analysis of iSyTE lens microarray datasets from mouse embryonic stages 10.5, 11.5 and 12.5 shows highly enriched expression of Celf1 compared to whole embryonic body tissue (WB) control. Celf1 microarray probe binding fluorescent signal intensity is represented on the Y-axis and the different mouse embryonic lens stages are shown on the X-axis. (C) At 2dpf (day post fertilization), (D) 3dpf and (E) 4dpf, zebrafish lenses exhibit expression of celf1 mRNA in the transition zone (arrow in C) and in later stages in the posterior region (arrows in D and E). (C’ to E’) High-magnification of C to E. (F) In Xenopus laevis, celf1 mRNA expression is observed from early developmental stage (St. 23) in the eye region (arrow; lens area indicated by broken white line). (F’) High-magnification of F. Lens area is indicated by broken white line. Asterisks in B represents a p-value less than 0.05. |
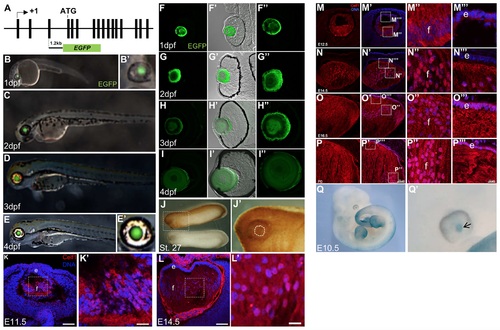
celf1 reporter gene analysis and protein expression in developing vertebrate lens. (A) Schematic of the zebrafish celf1 gene (not drawn to scale) shows the location of the ~1.2kb potential enhancer in the genomic region upstream of the start codon (which is located in exon 4). This ~1.2kb celf1 genomic region is fused to EGFP in the plasmid construct that is used in the reporter assays. (B to E’) Lens-specific expression of EGFP in zebrafish indicates strong celf1 enhancer activity at (B, B’) 1dpf, (C) 2dpf, (D) 3dpf and (E, E’) 4dpf. (F to I”) Transverse sections of zebrafish eye exhibit high EGFP expression at (F to F”) 1dpf, (G to G”) 2dpf, (H to H”) 3dpf and (I to I”) 4dpf. (J) In Xenopus laevis, at St. 27, high celf1 protein expression is present. (J’) High-magnification of dotted line area in J. Dotted-line circle shows lens region. (K and L) In mouse lens, high Celf1 protein expression is detected by a mouse monoclonal Celf1 antibody at stages E11.5 and E14.5. Fiber cells (f) and epithelium (e). (K’ and L’) High-magnification of dotted-line area in K and L, respectively. (M-P”‘) In mouse lens, rabbit Celf1 antibody detects Celf1 protein in lens development at stages E12.5, E14.5, E16.5 and P0. High magnification in dotted area is shown. In early stages, Celf1 protein is detected predominantly in fiber cells (f), and at later stages, while it retains high fiber cell expression, it is also detected in the epithelium (e). (Q) Celf1lacZKI/+ mouse reporter analysis reveals β-galactosidase activity in the lens at embryonic stage E11.5, indicative of endogenous Celf1 promoter/enhancer driven gene expression. (Q’) High-magnification of eye region in M’ shows high β-galactosidase activity in the lens (arrow). Scale bar in K and L is 75 μm while in K’ and L’ is 12 μm. |
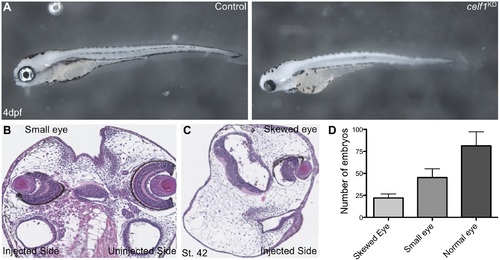
celf1 deficiency results in ocular defects in zebrafish and Xenopus laevis. (A) celf1 knockdown (KD) in zebrafish results in microphthalmia and clouding of the eye by 4dpf. (B and C) Histological analysis of X. laevis morphants at St. 42. celf1-knockdown (morpholino injected side) shows various eye defects such as (B) small eye and (C) skewed eye, that are absent in the control uninjected side. (D) Graph representing the distribution of the observed eye defects in X. laevis celf1 morphants from three independent experiments. PHENOTYPE:
|

Celf1 deficiency-mediated nuclear degradation defects are persistent. (A to B”) In mice, compared to control, Celf1cKO/cKO lens at stage P0 exhibits fiber cell nuclear degradation defects. Note the abnormal presence of nuclei (asterisks) in the central region of the fiber cells. A’ to B” are higher magnification images of A and B, respectively. (C to D”) Compared to control, Celf1lacZKI/lacZKI lens at seven-week age continue to exhibit nuclear degradation defects. Note the abnormal presence of nuclei (asterisks) in the central fiber cell region. C’ to D” are higher magnification images of C and D, respectively. (E and F) Compared to control where a clear nuclear free zone is visible (broken white line), Celf1lacZKI/lacZKI mouse lens at 4 months continue to exhibit nuclear degradation defects. Note the abnormal presence of nuclei (asterisks) in the central fiber cell region. (G to H’) Compared to control, zebrafish celf1 KD lens exhibits nuclear degradation defects at stage 5dpf. Note the abnormal presence of nuclei (asterisks) in the central fiber cell region. E’ and F’ are high-magnification of the dotted-line area in E and F. PHENOTYPE:
|