
- Title
-
Characterization of Triptolide-Induced Hepatotoxicity by Imaging and Transcriptomics in a Novel Zebrafish Model
- Authors
- Vliegenthart, A.D.B., Wei, C., Buckley, C., Berends, C., de Potter, C.M.J., Schneemann, S., Del Pozo, J., Tucker, C., Mullins, J.J., Webb, D.J., Dear, J.W.
- Source
- Full text @ Toxicol. Sci.
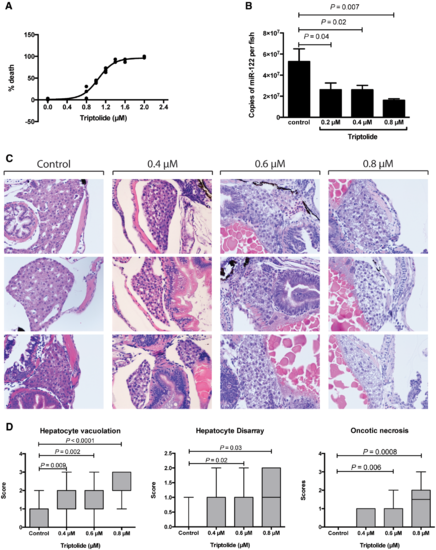
Effect of triptolide on zebrafish larvae after 48 h (3–5 dpf) exposure. A, Survival of zebrafish larvae after TP exposure at the concentrations indicated. Each dot represents mean mortality of 30 larvae. B, Copies of miR-122 per larva after 48 h of exposure at the concentrations indicated (from 3 to 5 dpf). C, Histological images of zebrafish larvae after exposures of the TP concentrations indicated. Three representative fish are presented per TP dose. D, Box plots (min to max) of histology scores for hepatocyte vacuolation, hepatocyte disarray and oncotic necrosis after TP exposure at the concentrations indicated (control N = 12, 0.4 µM N = 20, 0.6 µM =18 and 0.8 µM N = 18). |

3D images of livers captured by SPIM. 3 dpf zebrafish larvae were exposed to 1.6 µM triptolide or vehicle control. After 6 h of exposure the first image was captured and subsequent images were taken at 4 and 5 dpf. |
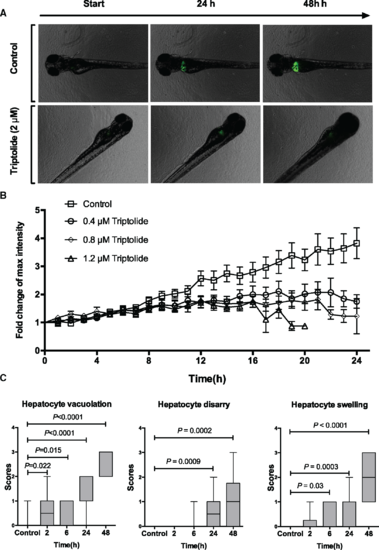
Time-course of triptolide-induced liver injury. A, Fluorescent images of control and TP exposed fish obtained during time-lapse experiments at the indicated time from start of exposure. B, Relative fold change of fluorescent intensity from baseline during TP exposure with the doses indicated (N = 15 larvae for each dose). C, Box plots (min to max) of histology scores of hepatocyte vacuolation, hepatocyte disarray and hepatocyte swelling during exposure to TP (0.8 µM) for the time durations indicated (control N = 17, 2 h N = 10, 6 h N = 9, 24 h N = 16, 48 h N = 20). |
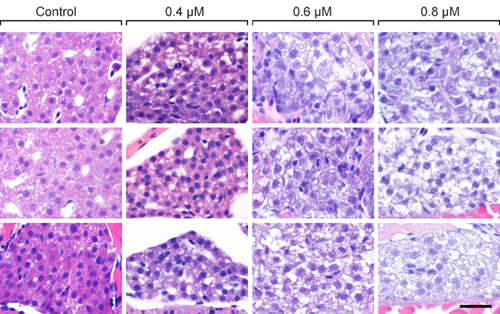
Effect of triptolide on zebrafish larvae after 48 hours (3-5dpf) exposure. Magnified histological images at x400 of zebrafish larvae liver after water exposure to triptolide at the concentrations indicated. Three representative fish are presented for each dose. Note the presence of dose dependent increase in hepatocyte vacuolation (A), necrosis (with nuclei breaking down (B) and karyolysis (C)) and the presence of disarray (red lines). The latter two features are absent from the control group. Scale bar = 20µm. |
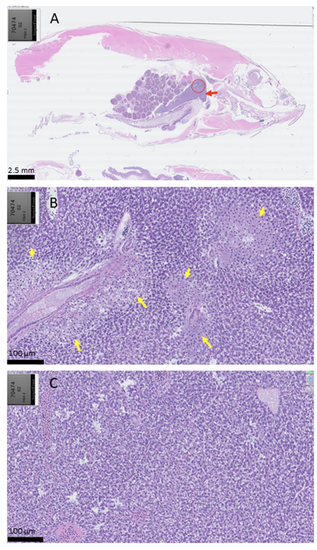
Histological images of adult zebrafish after exposure to triptolide (1.6 μM) for 10 hours. (A) Subgross view. Liver is indicated by the red arrow. The area displaying hepatic necrosis is indicated by the circle. (B) Arrows denote lesions consistent with hepatic necrosis after triptolide exposure. (C) Control adult zebrafish after exposure to vehicle control. Normal liver, with no areas of necrosis. |