
- Title
-
A tunable refractive index matching medium for live imaging cells, tissues and model organisms
- Authors
- Boothe, T., Hilbert, L., Heide, M., Berninger, L., Huttner, W.B., Zaburdaev, V., Vastenhouw, N.L., Myers, E.W., Drechsel, D.N., Rink, J.C.
- Source
- Full text @ Elife

Iodixanol is live specimen compatible. (a) Iodixanol does not affect growth and cell death levels in cultured HeLa cells. Left: Representative low-resolution images of the constitutively expressed nuclear marker H2B-mCherry at indicated incubation times and media conditions. Scale bar = 50 µm; Right: Quantification of cell numbers (number of nuclei) and dead cells (DRAQ7 positive nuclei) at the indicated time points and Iodixanol concentrations. Iodixanol was applied 24 hr post seeding and measurements were normalized to the 24 hr time point in order to compensate fluctuations in plating density. n = 3; See Figure 2—figure supplement 1 for a complete data representation. (b) Iodixanol does not affect developmental growth or survival of dechorionated zebrafish embryos. Left: Representative images of developing embryos at the indicated time points (hpf = hours post fertilization) and media conditions. N = 5; Scale bars = 100 µm at 2 and 16 hpf, 500 µm at 48 and 72 hpf. Right: Quantification of body length and survival rate at the indicated time points and media conditions. The initial drop in the survival curves is an effect of dechorionation. N = 30; (c) Iodixanol does not affect regeneration of the planarian head or body proportions. Left: Representative images of regenerating Dendrocoelum lacteum amputation fragments at the indicated time points (dpa = days post amputation) and under the indicated media conditions. Anterior is always up, Scale bar = 500 µm; Right: Quantification of length/width ratio and projected area at the indicated time points and media conditions. Measurements were normalized to the 0 time point in order to compensate initial size differences between tissue pieces. N = 3; (a–c) Error bars represent S.E.M. p>0.05 in all cases: (a) one way ANOVA (b, c) paired t-test. |
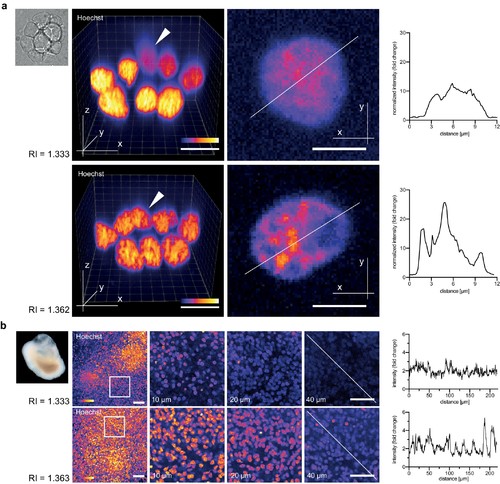
Refractive index tuning with Iodixanol improves live-imaging of tissue culture systems. (a). Effects of Iodixanol supplementation on live imaging of primary zebrafish cell cultures. Top Left: Brightfield image of a representative cluster of primary zebrafish embryonic cells, approximatly 50 µm in diameter. Centre panel: Images of cell clusters stained with the nuclear dye Hoechst 33342. Left column: 3D-reconstruction of representative multi-layered cell clusters, imaged in control media (RI = 1.333, top row) or in refractive index matched media (RI = 1.362, bottom row) under identical imaging conditions. The arrowheads indicate representative deep layer nuclei that are further shown as 2D optical XY-section in the right column. Graphs: Intensity profiles along the solid lines indicated in the respective xy-section image. The flatter and lower intensity profile in the control condition (top) quantitatively documents a loss of chromatin structure fine detail in deep nuclei, which is preserved by Iodixanol supplementation (bottom). Scale bars = 3D: 10 µm and 2D: 5 µm See Figure 3—figure supplement 1 for orthogonal sections. (b) Effects of Iodixanol supplementation on live imaging of human cerebral organoids. Top left: Dark field image of a representative human cerebral organoid approximately 2 mm in diameter. Centre panel: Human cerebral organoids at culture day 67 stained with the nuclear dye Hoechst 33342. Centre panel: 3D-imaging of organoids, mounted either in standard media (RI = 1.333, top row) or in refractive index matched media (RI = 1.363, bottom row) under identical imaging conditions. Left column: Maximum projections of representative z-stacks. The white frame indicates the region shown to the right as optical xy-sections at the indicated tissue depth. The solid white line across the deepest section traces the course of the pixel intensity profile shown to the right. The flatter and lower intensity profile in the standard condition (top) quantitatively documents the loss of nuclear signal at 40 µm depth, while Iodixanol supplementation (bottom) still allows nuclei detection at that depth. Scale bars = 50 µm. The color scheme encodes relative intensity (brightest = white). |
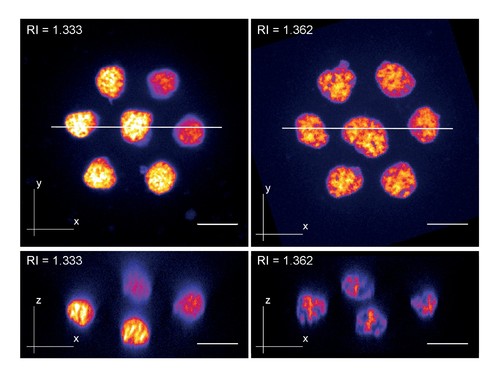
Zebrafish primary cell culture. Top row shows maximum projected images of cell clusters imaged in standard media (RI = 1.333, left) or refractive index adjusted media (RI = 1.362, right). The bottom row shows orthogonal optical sections at the positons indicated with the solid line in the top row. Overall, the images document a loss of resolution along the Z-axis (= increasing distance from the coverslip) in standard mounting media, which can be prevented by Iodixanol supplementation. |

Refractive index tuning with Iodixanol improves model organism live-imaging. (a). Effects of Iodixanol supplementation on zebrafish embryo live imaging. Top left: Stereoscopic image of a dome stage zebrafish embryo of approximately 700 µm diameter. Centre panel: Zebrafish embryos expressing RFP-PCNA were injected at the single cell stage with 200 nm fluorescent sub-diffraction sized beads and imaged at dome stage (4 hpf). Images (left column: RFP-PCNA, right column: beads) represent 50 µm thick y-maximum projections of embryos imaged in regular media (RI = 1.333, top row) or in Iodixanol supplemented media (RI = 1.363, bottom row). Scale bars = 50 µm. The graphs to the right depict the quantification of point spread functions of individual beads (N = 20) at shallow (top) or deep (bottom) imaging depth, each for control and Iodixanol mounted specimens as per the indicated color scheme. The position of the analysed planes is indicated in the bead images to the left. The quantification of the width of the point spread function at half-maximal amplitude (See Supplementary file 1 for numerical results) reveals a significant increase in resolution in deep sections. (b) Effects of Iodixanol supplementation on planarian live imaging. Top left: Dark-field image of a specimen of the planarian flatworm Dendrocoelum lacteum approximately 4 mm in length. Centre panel: Live Dendrocoelum lacteum were stained with the nuclear marker RedDot1 and mounted in control media (RI = 1.333, top) or media Iodixanol-tuned to RI = 1.412 (bottom). The large images represent z-maximum projections of image stacks in the head region, with the solid line indicating the position of the single-plane orthogonal yz-section shown to the right. The scatter plots of mean nuclear intensity versus depth to the right quantitatively document an improved signal return upon Iodixanol supplementation, especially from deeper tissue layers. Scale bars = 50 µm. The color scheme encodes relative intensity (brightest = white). |
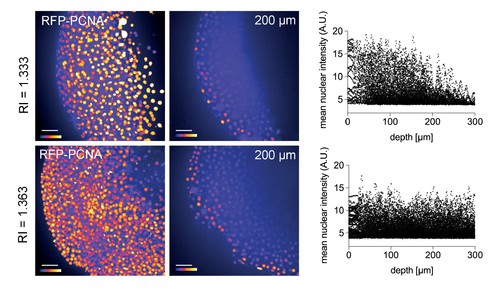
Improved nuclear segmentation in deep tissue layers by Iodixanol supplementation. four hpf zebrafish embryos expressing RFP-PCNA. Top row: Maximum projection (left) and optical XY-section at 200 µm depth (right) of an embryo in regular media (RI = 1.333) highlights a progressive loss of nuclear signal detection and segmentation beyond 100 µm imaging depth, which is quantified in the scatter plot of mean nuclear intensity versus depth (right). Bottom row: RI tuning with Iodixanol to RI = 1.363 enables nuclear detection and segmentation at up to 300 µm imaging depth. Panel order and imaging conditions exactly as above. Scale bars = 50 µm. The colour scheme encodes relative intensity (brightest = white). |