
- Title
-
Thiopeptide Antibiotics Exhibit a Dual Mode of Action against Intracellular Pathogens by Affecting Both Host and Microbe
- Authors
- Zheng, Q., Wang, Q., Wang, S., Wu, J., Gao, Q., Liu, W.
- Source
- Full text @ Chem. Biol.
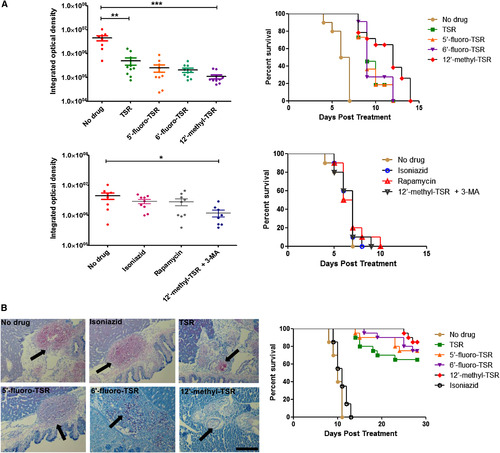
Measurement of In Vivo Anti-infective Activities of Drugs (A) M. marinum-infected zebrafish larvae (n = 10) in the presence of each test drug (3 μM). Left: Fluorescence intensity of GFPmut3-expressing bacteria in larvae 5 days after treatment (∗p < 0.05, ∗∗p < 0.01, ∗∗∗p < 0.001; error bars represent the standard deviation). Right: larval survival during the treatment period. (B) M. marinum-infected zebrafish adults (n = 20) treated once with each test drug (10 μl of 5 μM). Left: Pathological section of the infected area of randomly selected adults 10 days after treatment. The arrow indicates the existing or obliterated bacterial burden (red). Scale bar, 100 μm. Right: Adult survival during the treatment period. PHENOTYPE:
|

Related to Figure 2 and 3. Treatments of M. marinum-infected zebrafish larvae (A, 3 µM) and adults (B, intraperitoneal injection 10 µL of 5 µM solution) with various drugs. Samples shown here were randomly chosen. |