
|
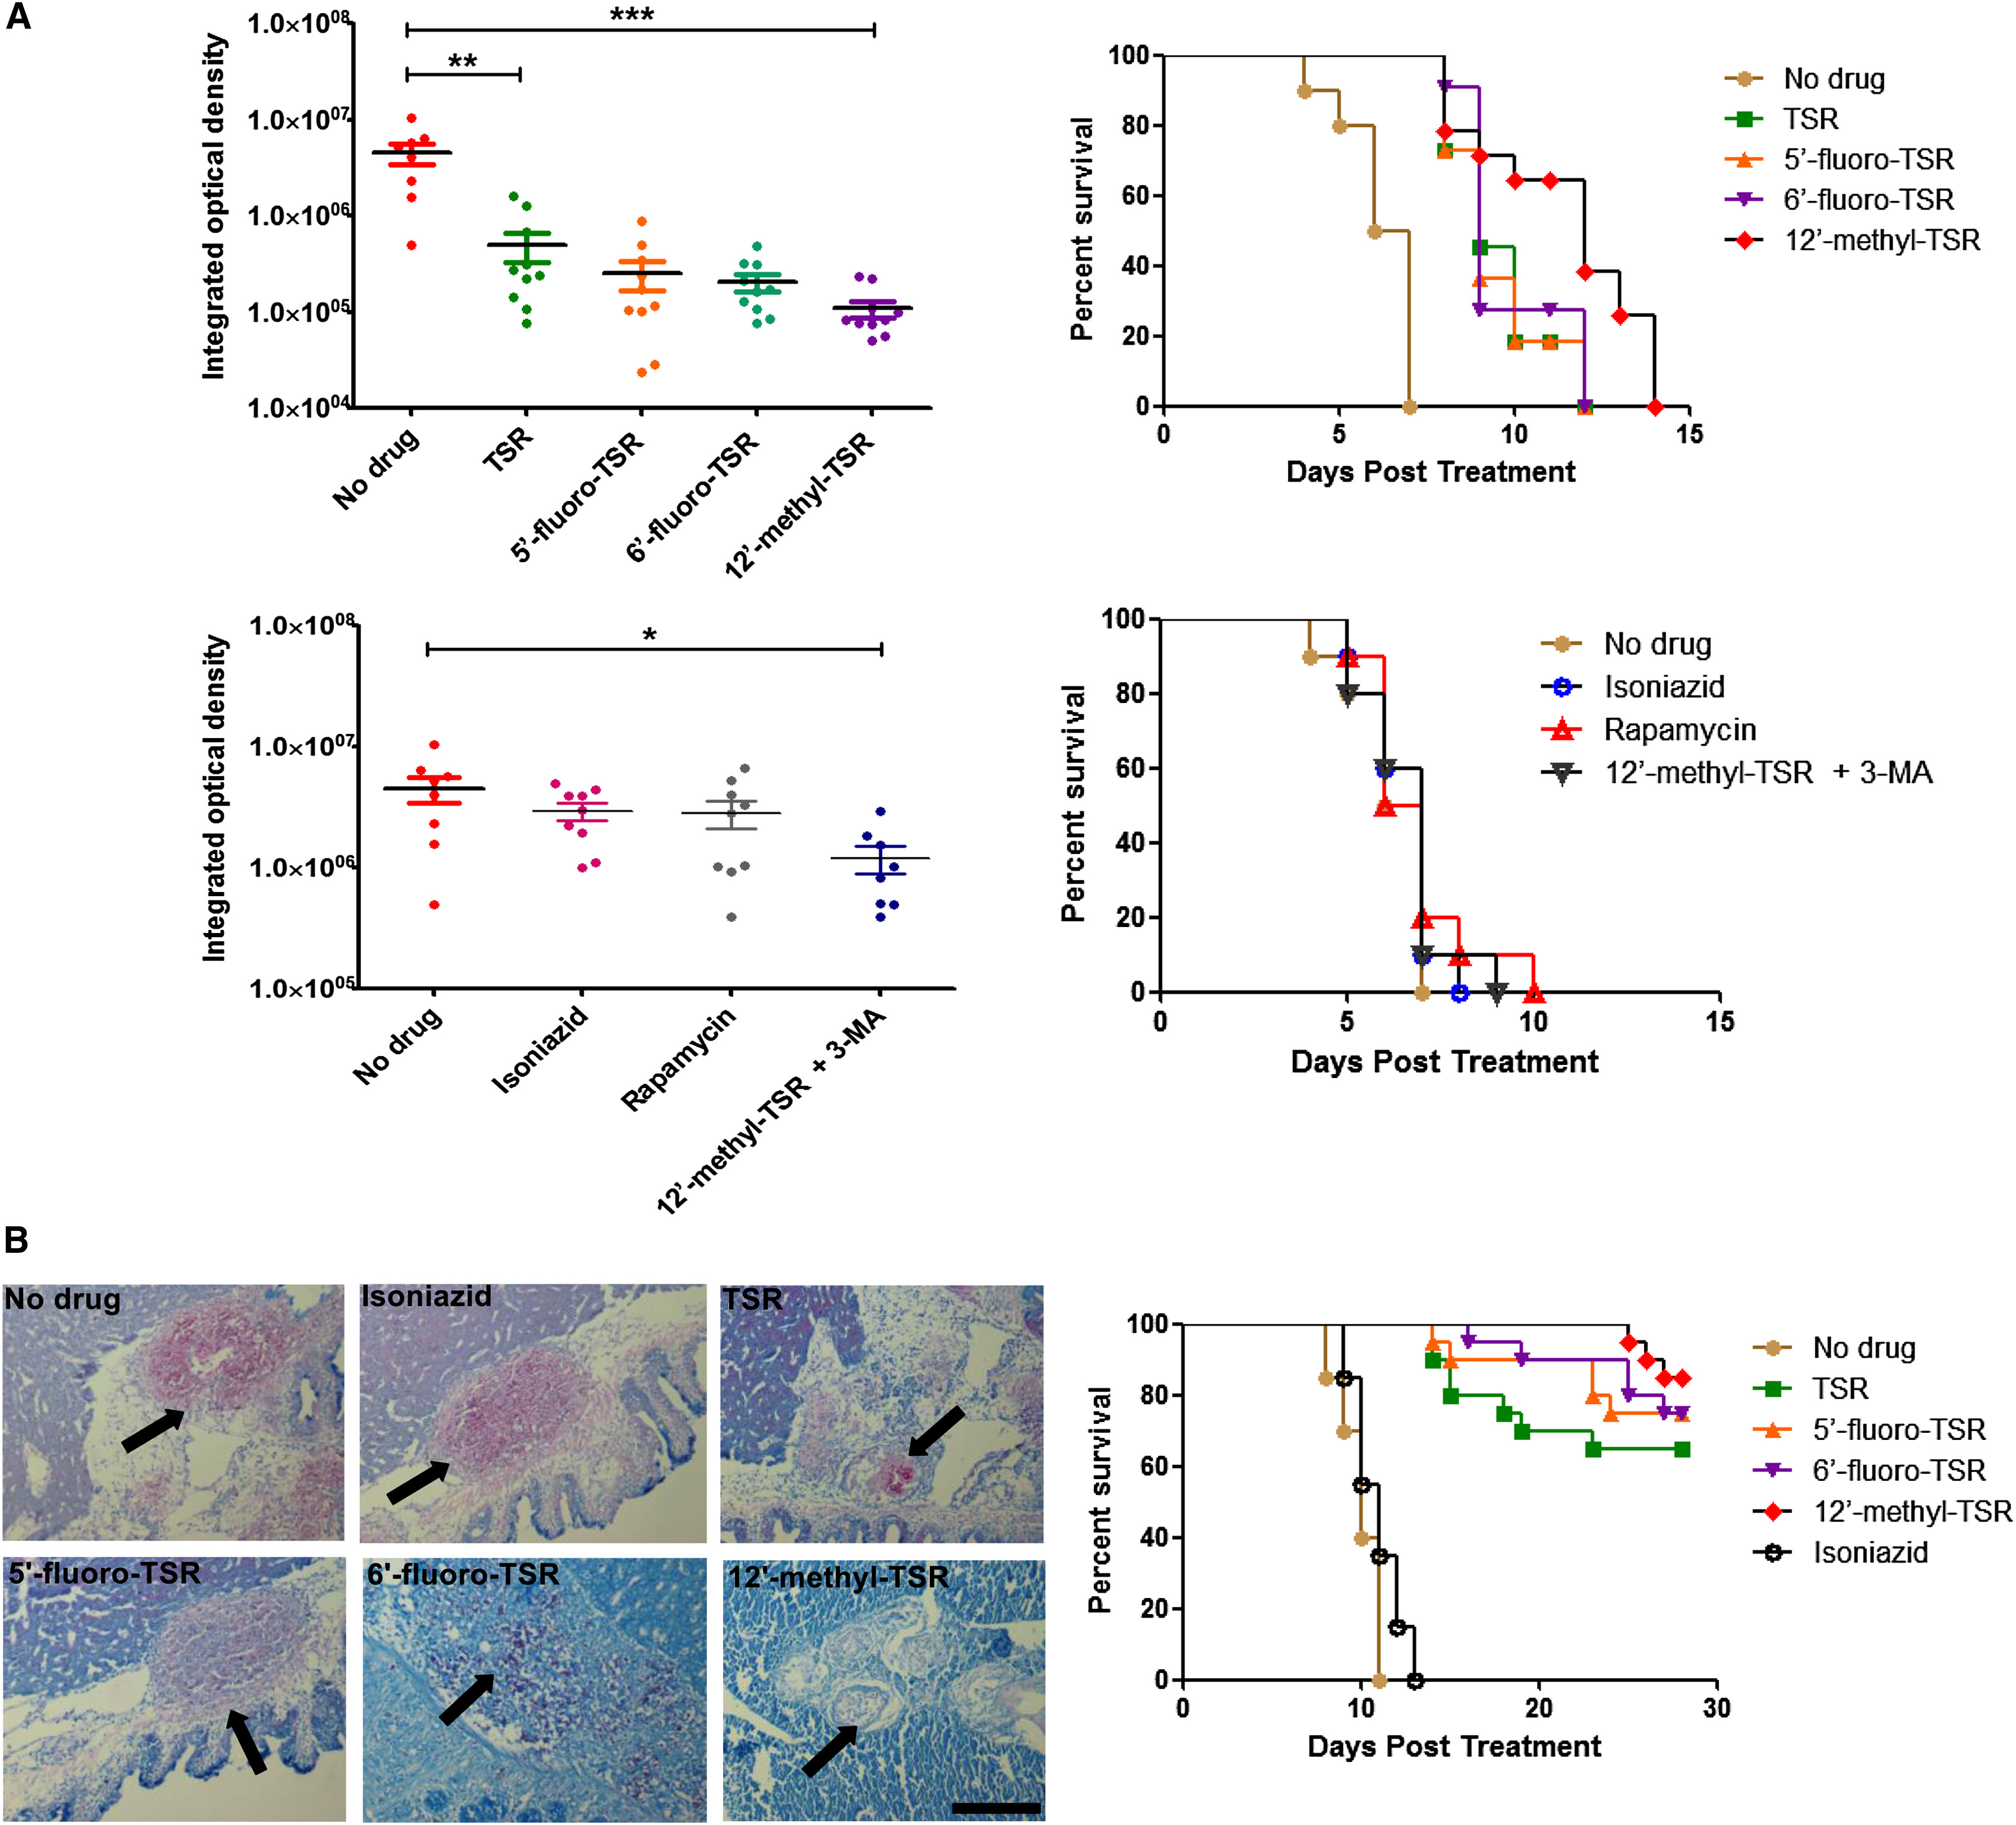
Fig. 2
Measurement of In Vivo Anti-infective Activities of Drugs
(A) M. marinum-infected zebrafish larvae (n = 10) in the presence of each test drug (3 μM). Left: Fluorescence intensity of GFPmut3-expressing bacteria in larvae 5 days after treatment (∗p < 0.05, ∗∗p < 0.01, ∗∗∗p < 0.001; error bars represent the standard deviation). Right: larval survival during the treatment period.
(B) M. marinum-infected zebrafish adults (n = 20) treated once with each test drug (10 μl of 5 μM). Left: Pathological section of the infected area of randomly selected adults 10 days after treatment. The arrow indicates the existing or obliterated bacterial burden (red). Scale bar, 100 μm. Right: Adult survival during the treatment period.